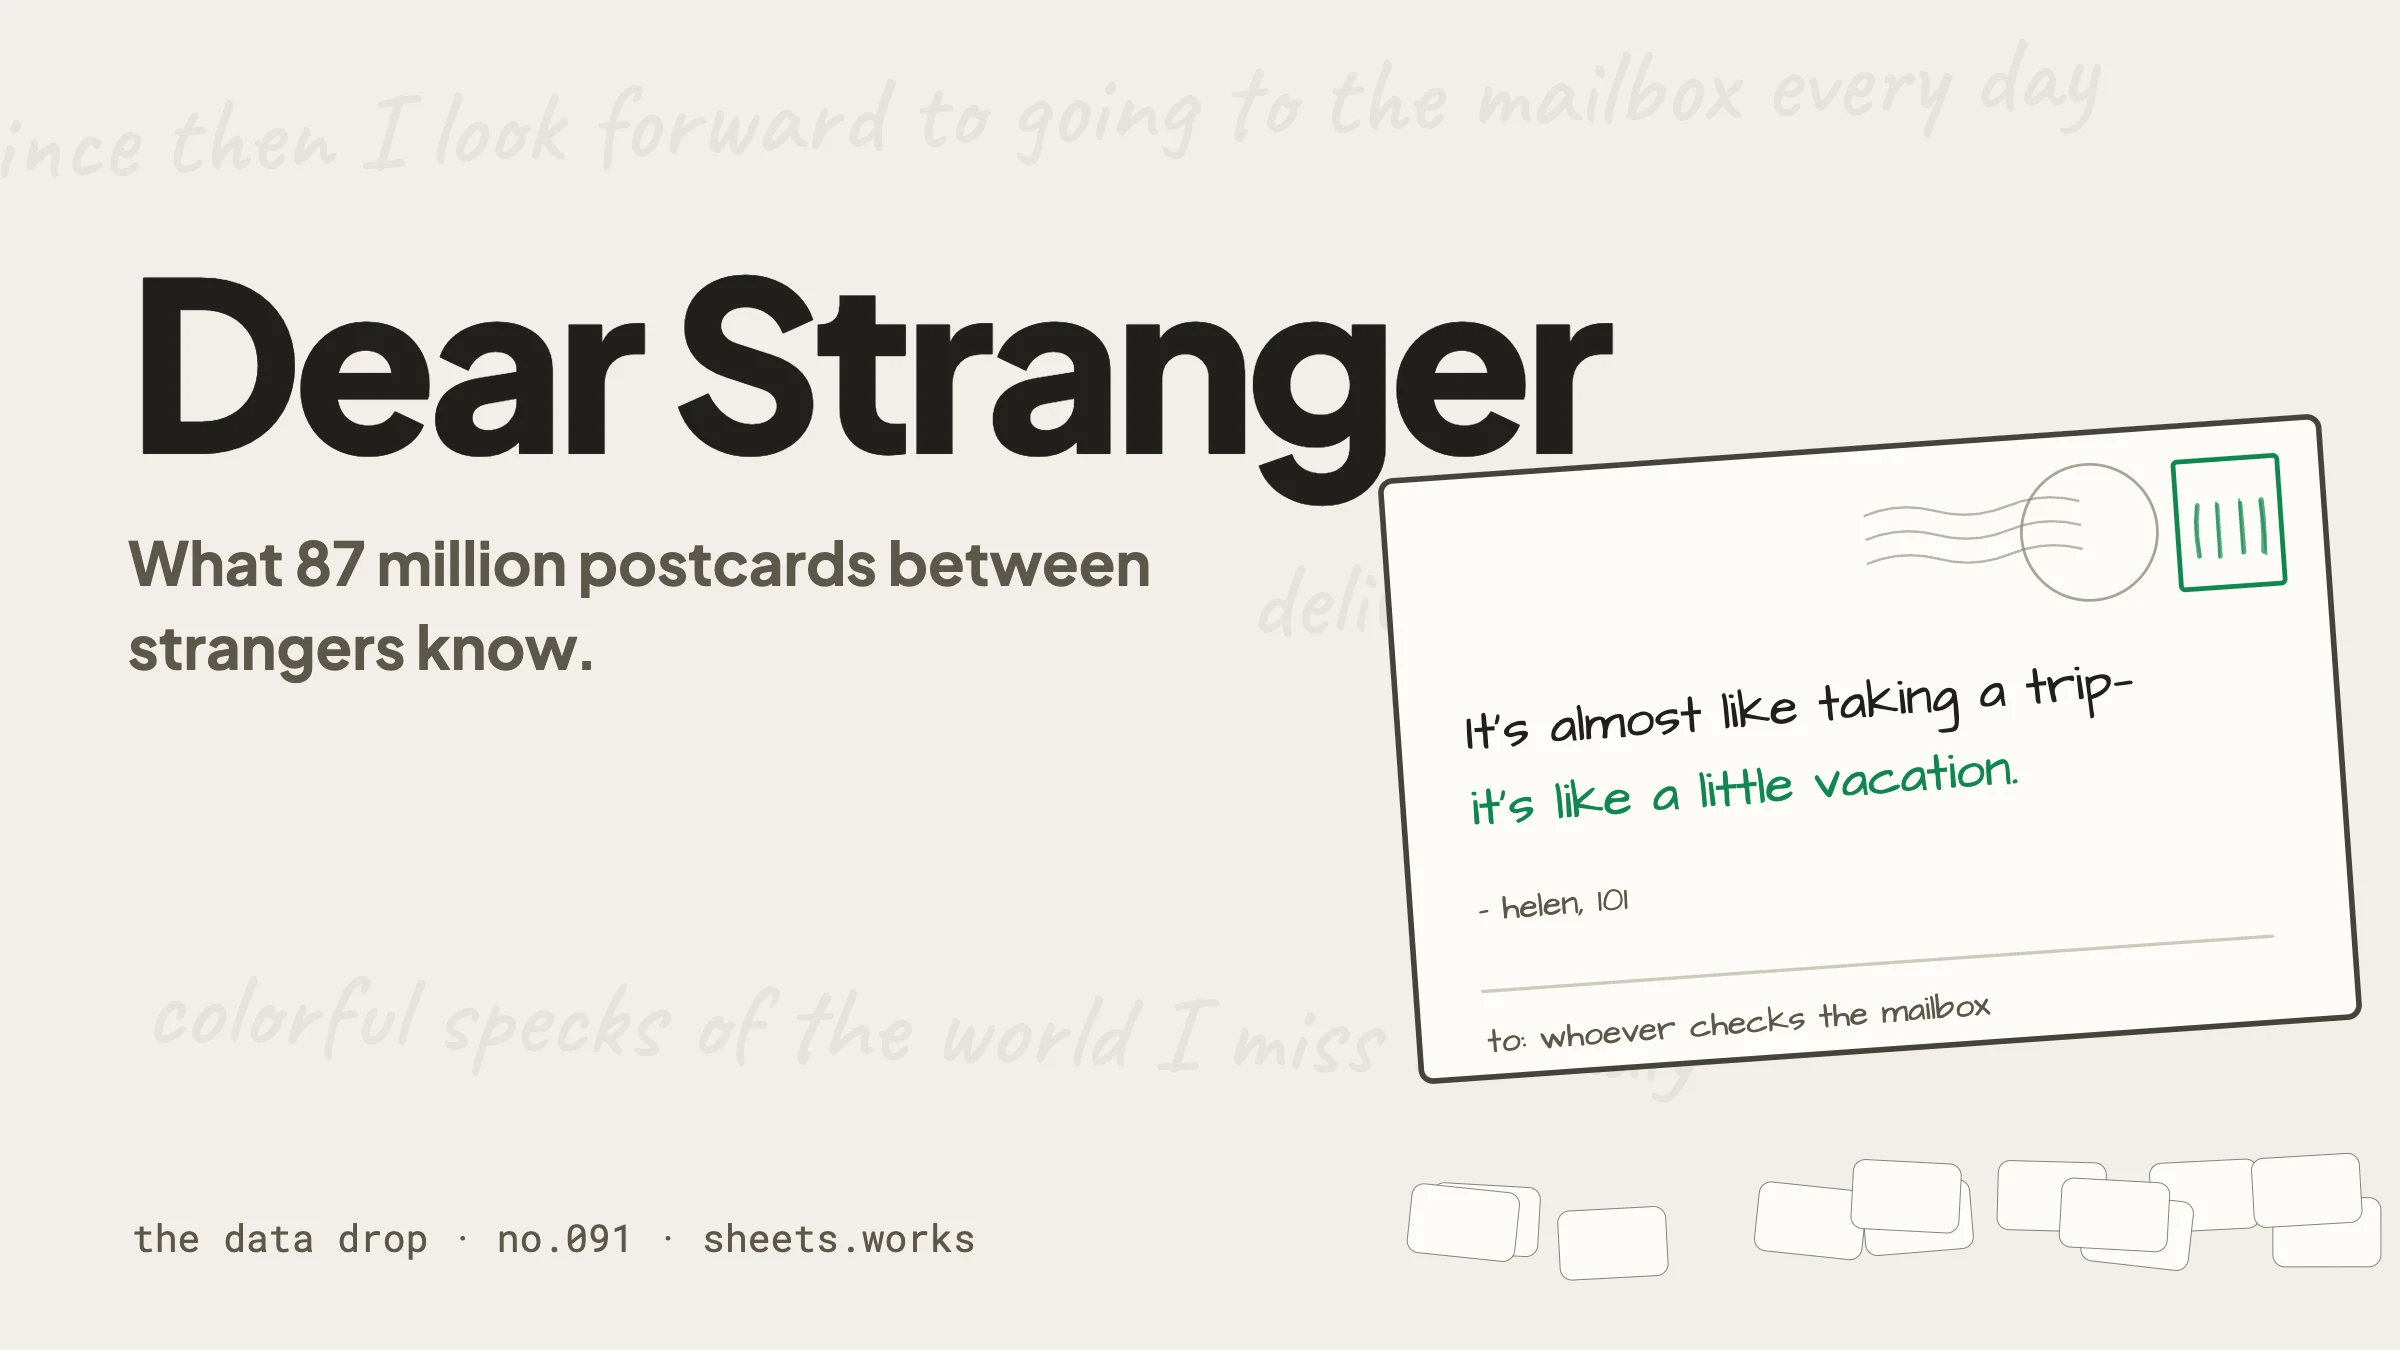
Dear Stranger
A website where you mail a postcard to a stranger, and a different stranger writes back. 21 years, 87 million cards, drawn by hand.

You Never Finished Red Dead
Only 1 in 5 people saw the end of Red Dead 2. Here's exactly where everyone stopped, and why you should go back.
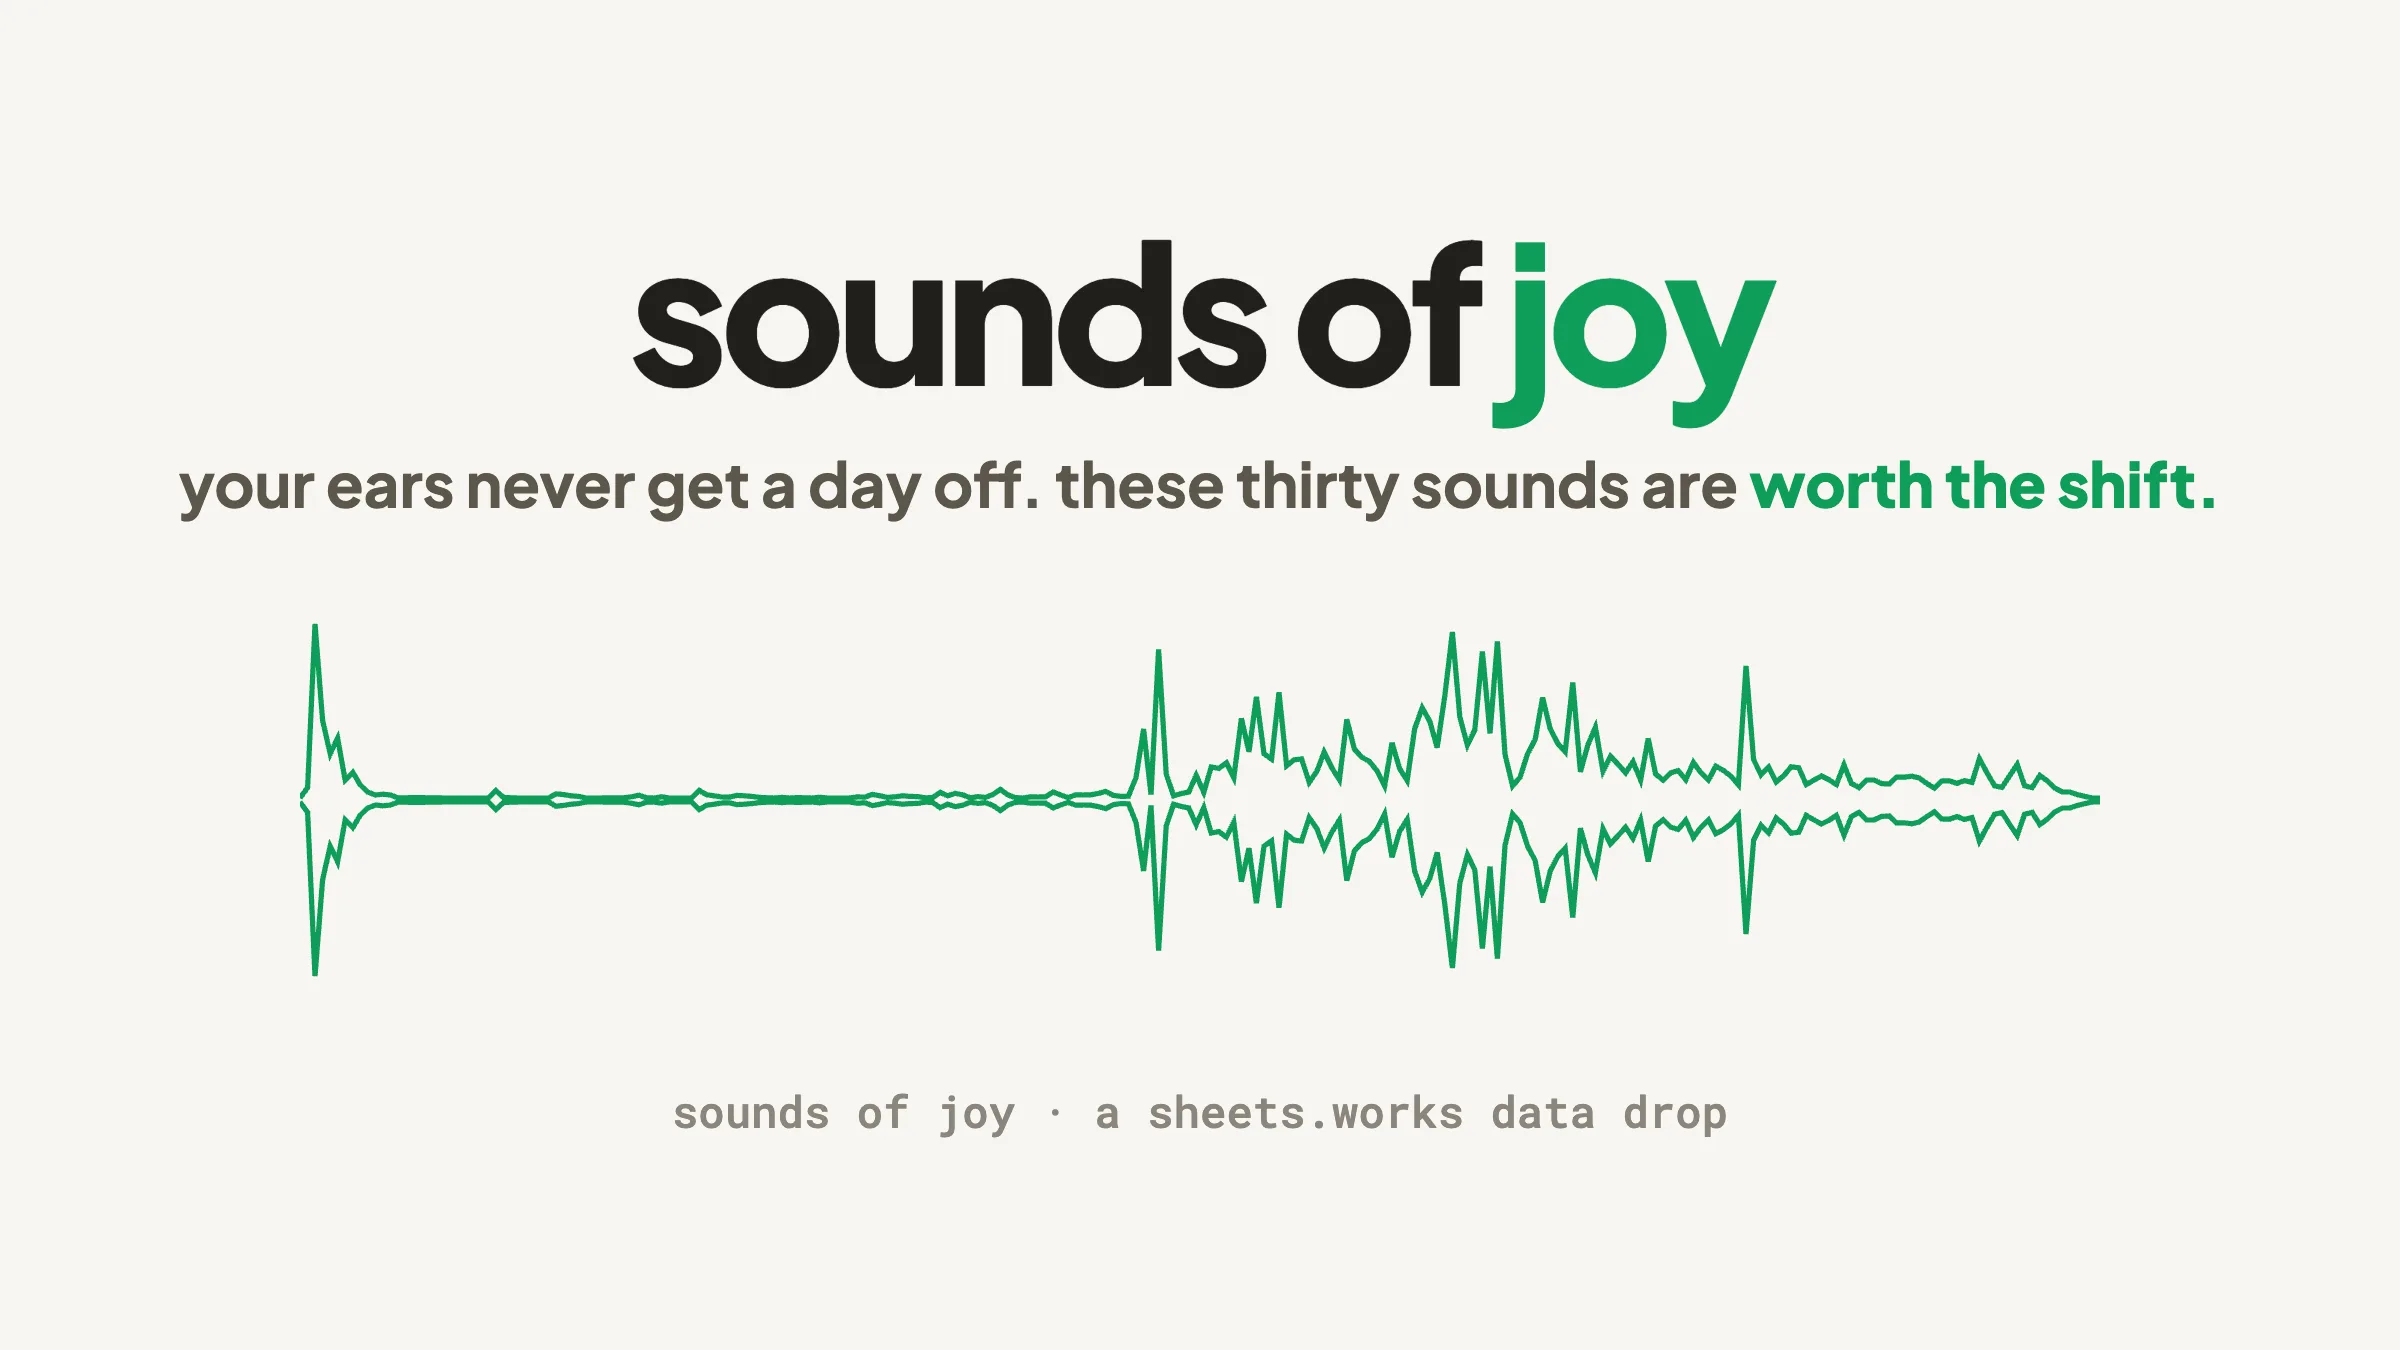
Sounds of Joy
Your ears never get a day off. These thirty sounds are worth the shift: real recordings, measured, playable, sourced.
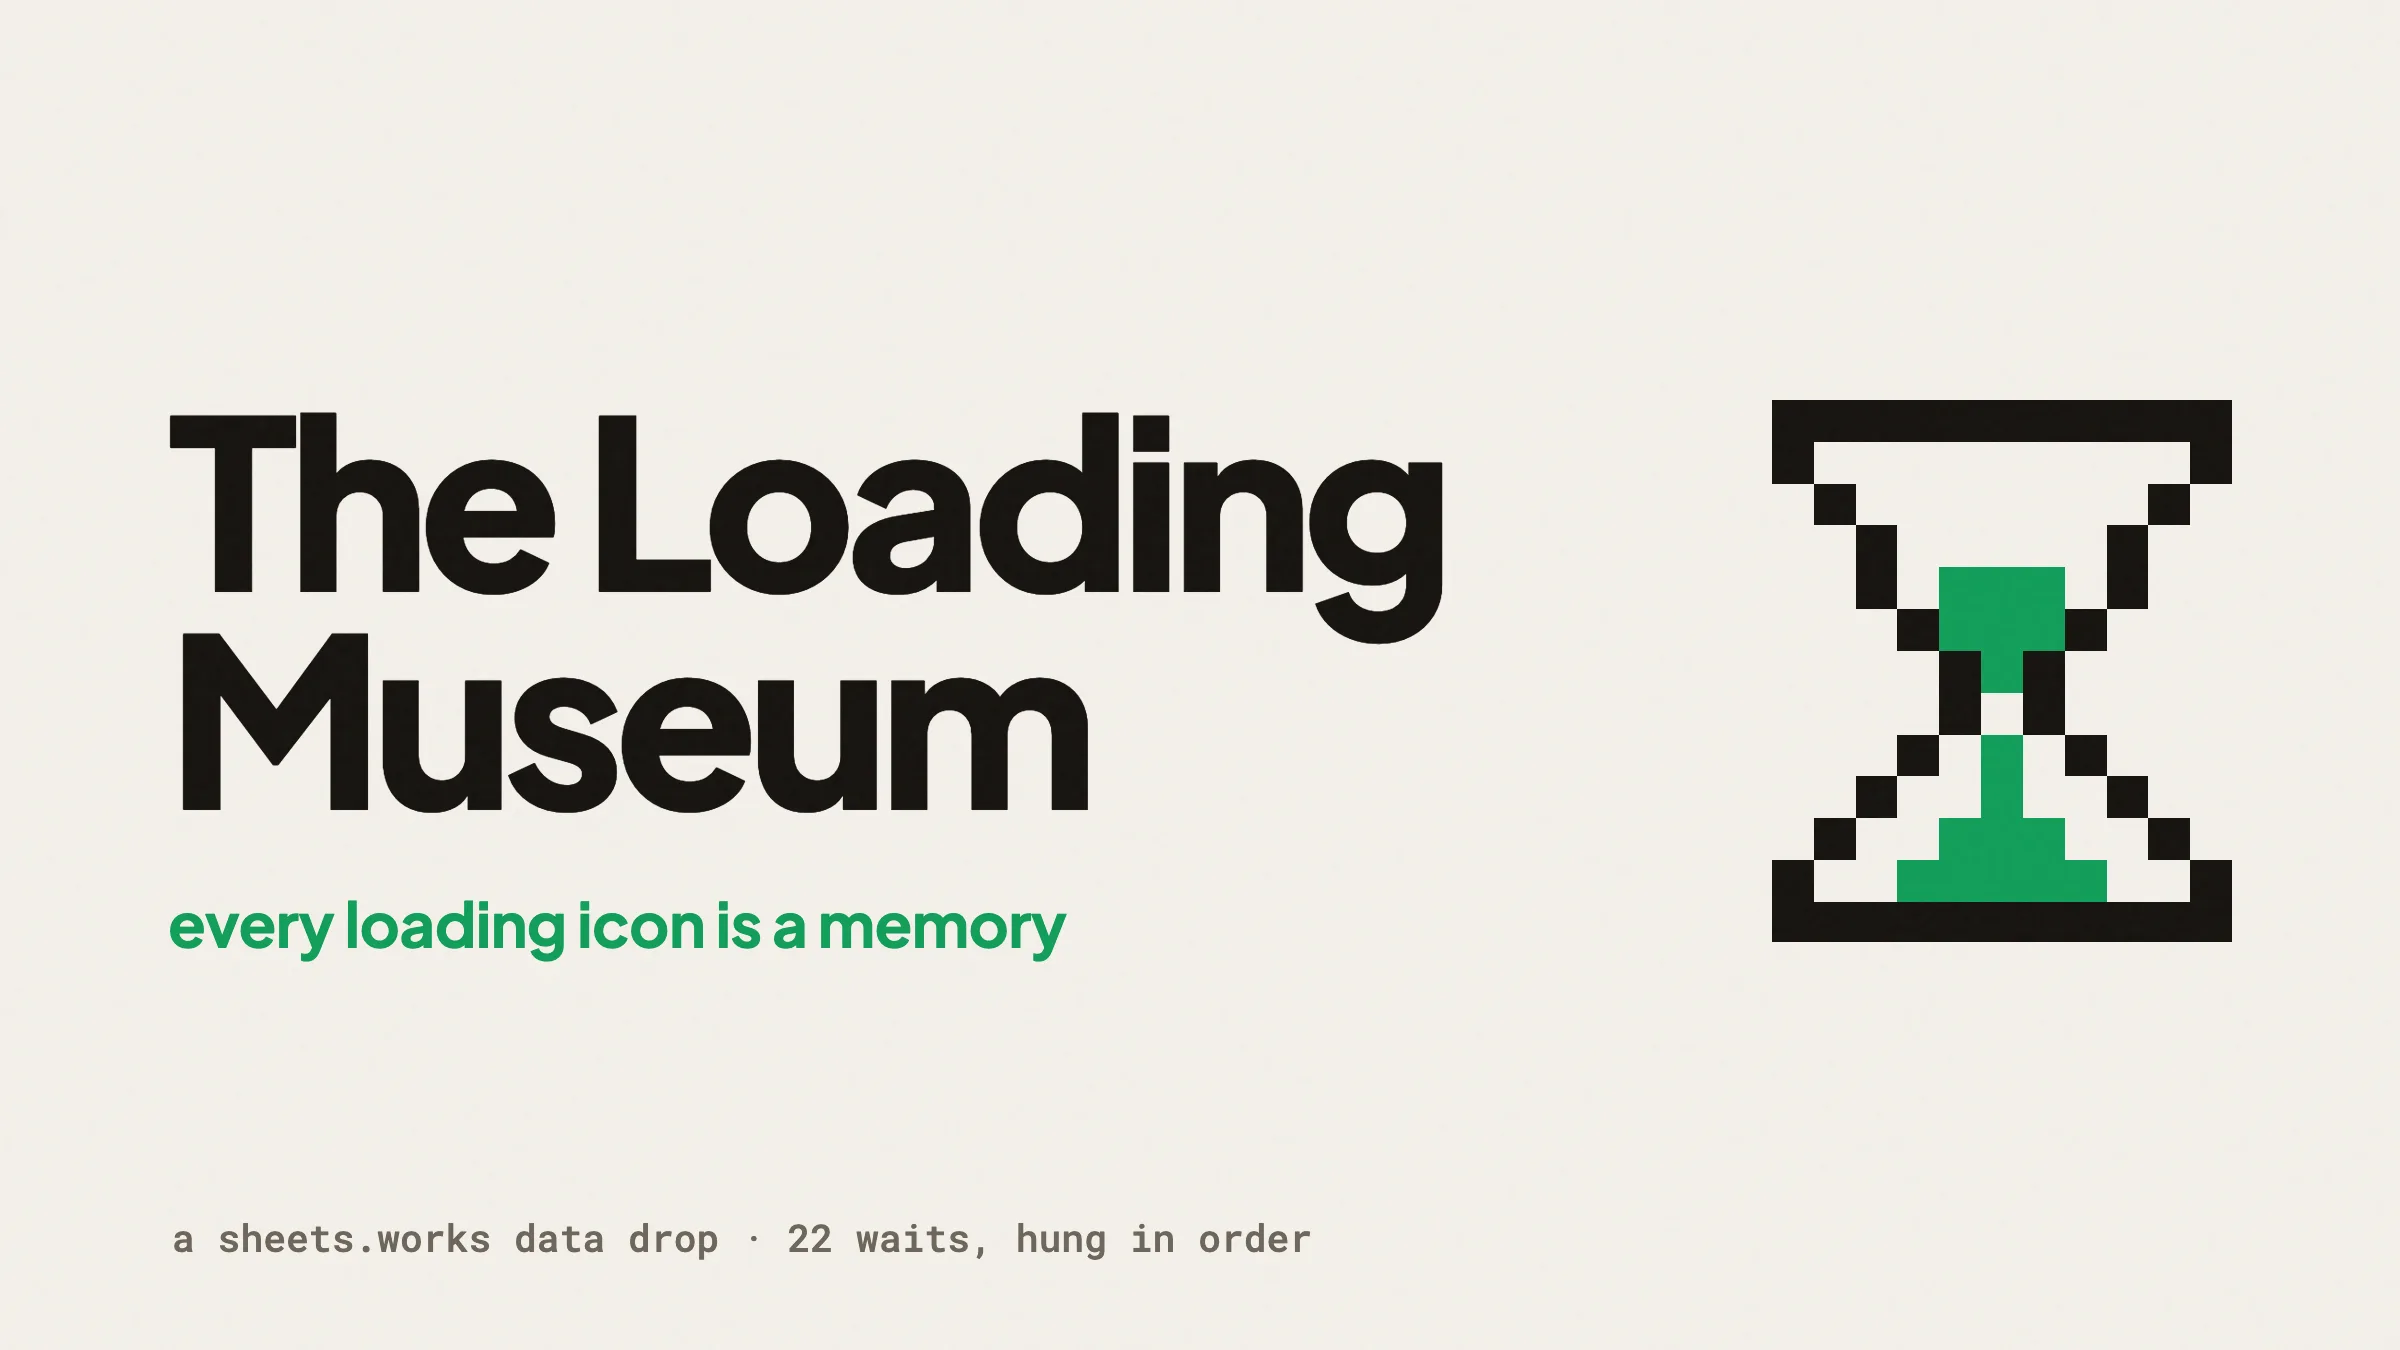
The Loading Museum
Every loading icon is a memory. 22 of them, and every one makes you actually wait.
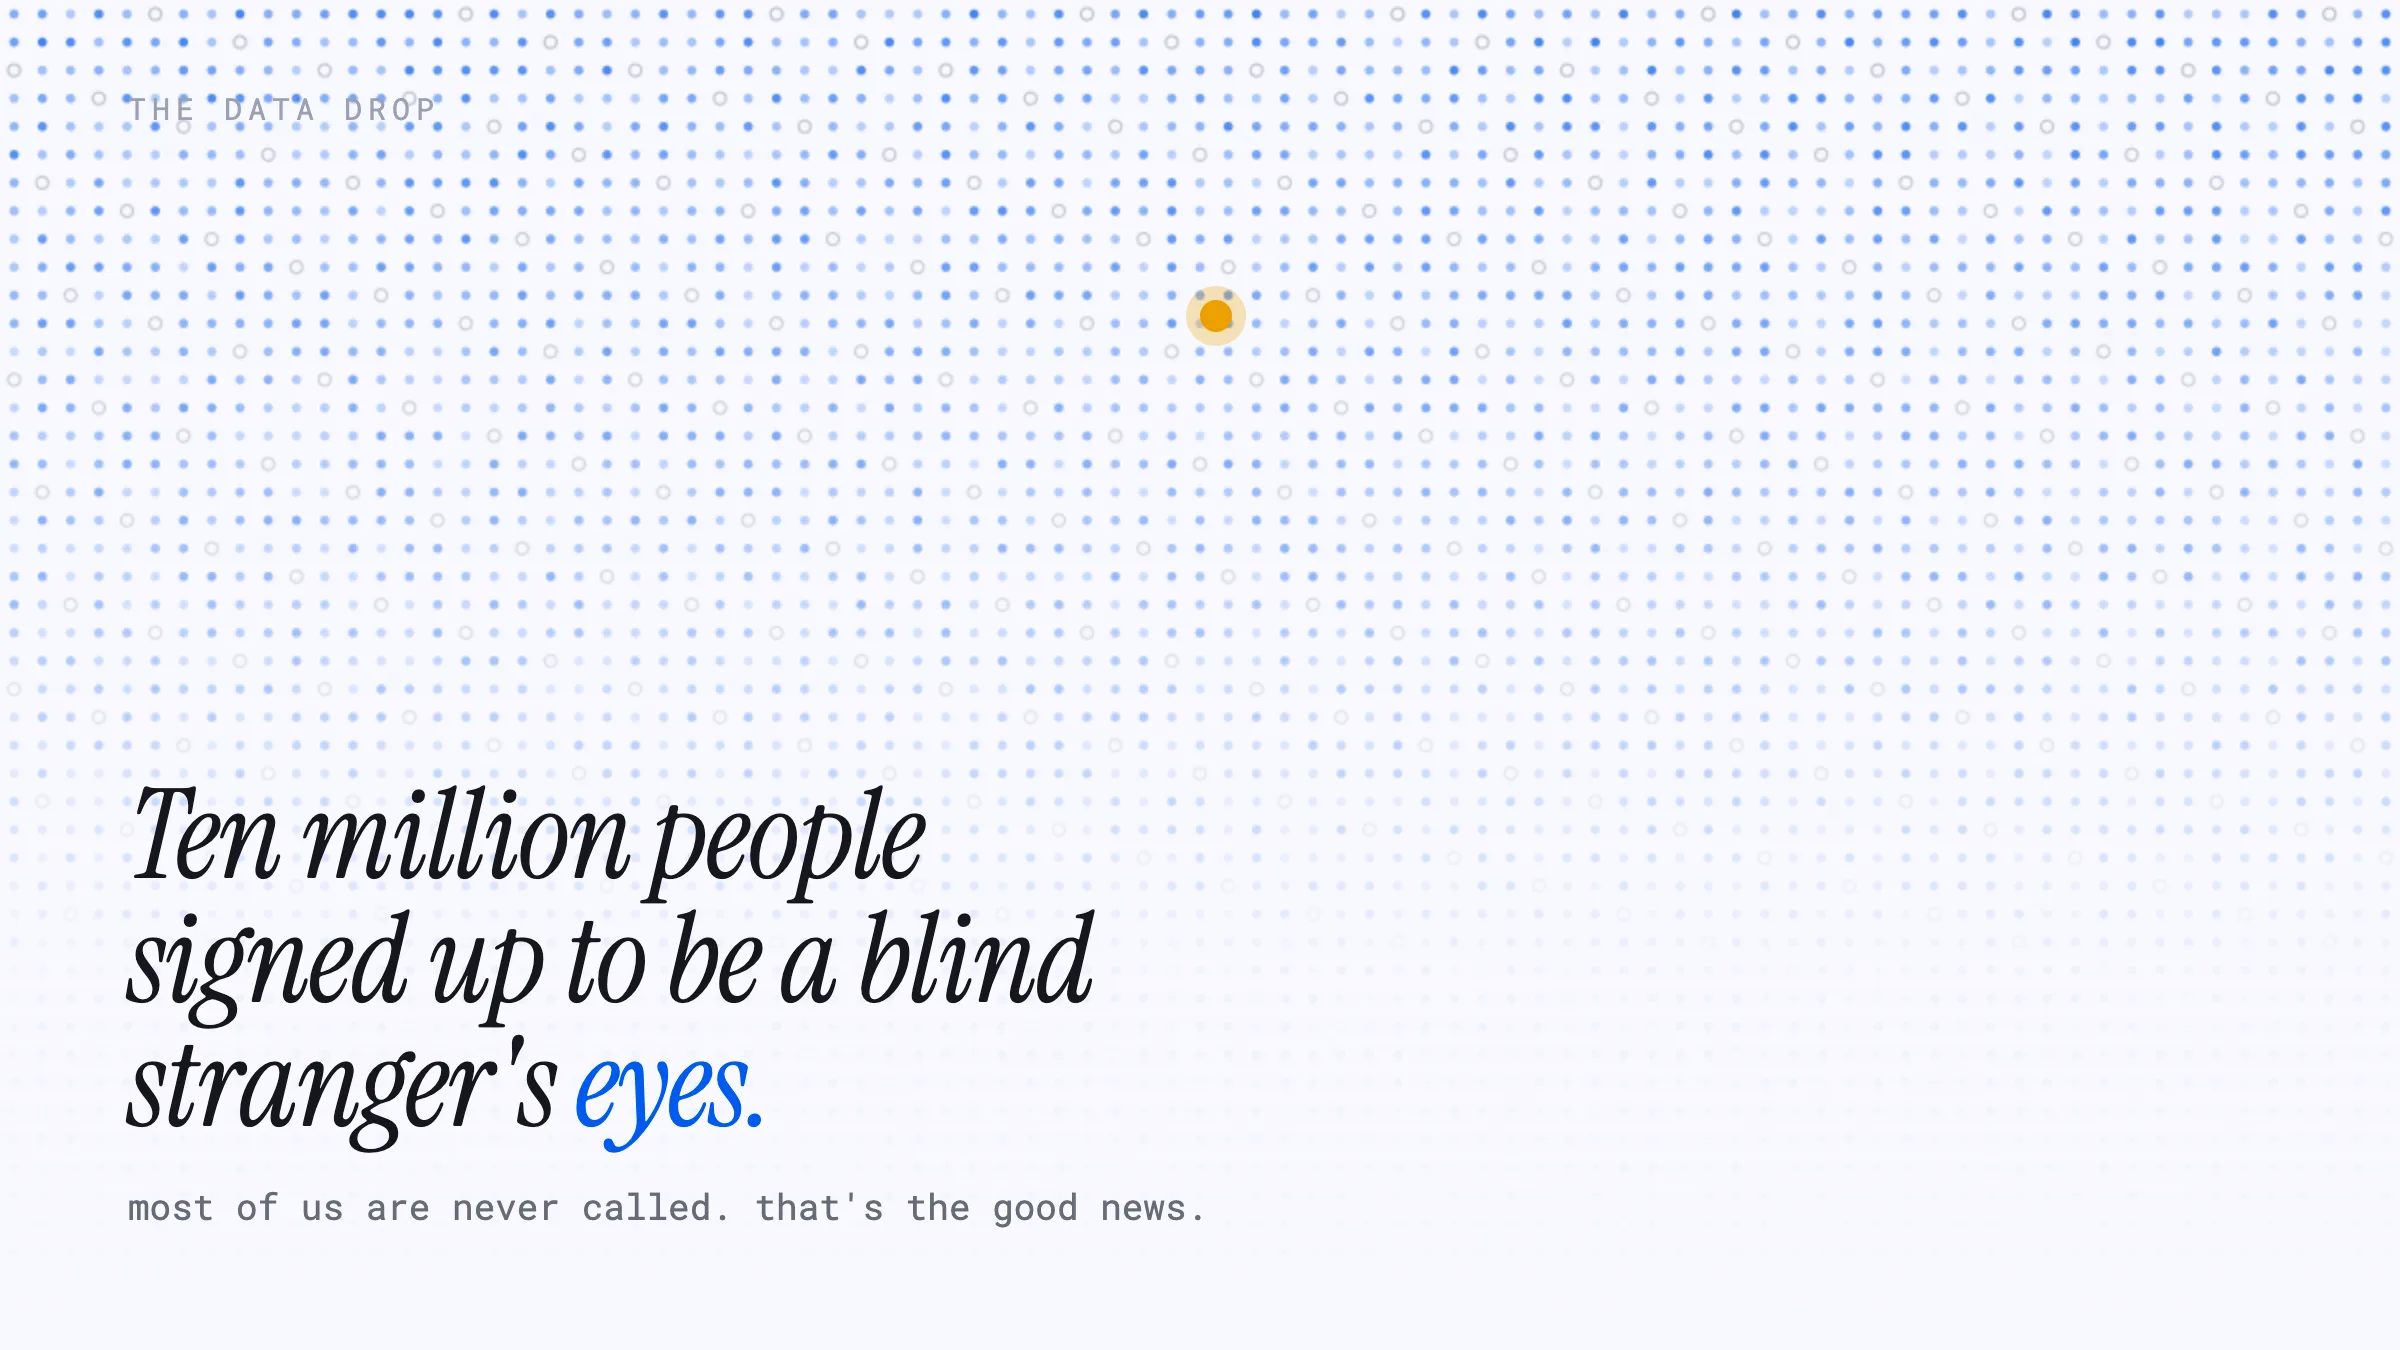
I signed up to be a blind stranger's eyes
Ten million people volunteered to be the eyes of a blind stranger. Most of us are never called. That's the good news.
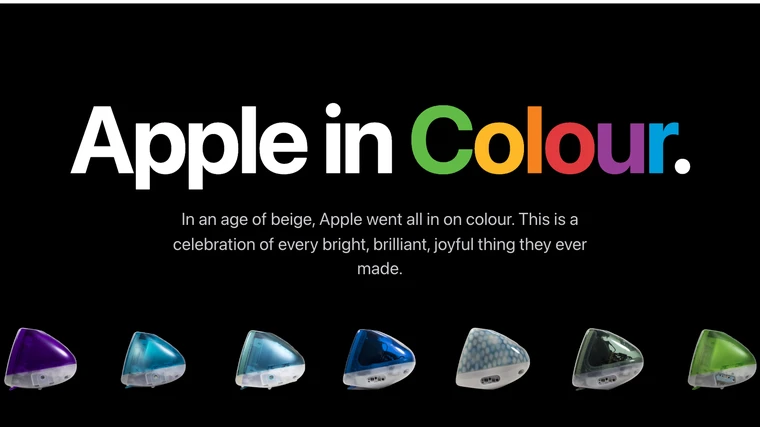
Apple in Colour
Every bright, colourful thing Apple ever made, from Bondi Blue on.
Count to Ten
The first thing you ever learned, 73 more times.
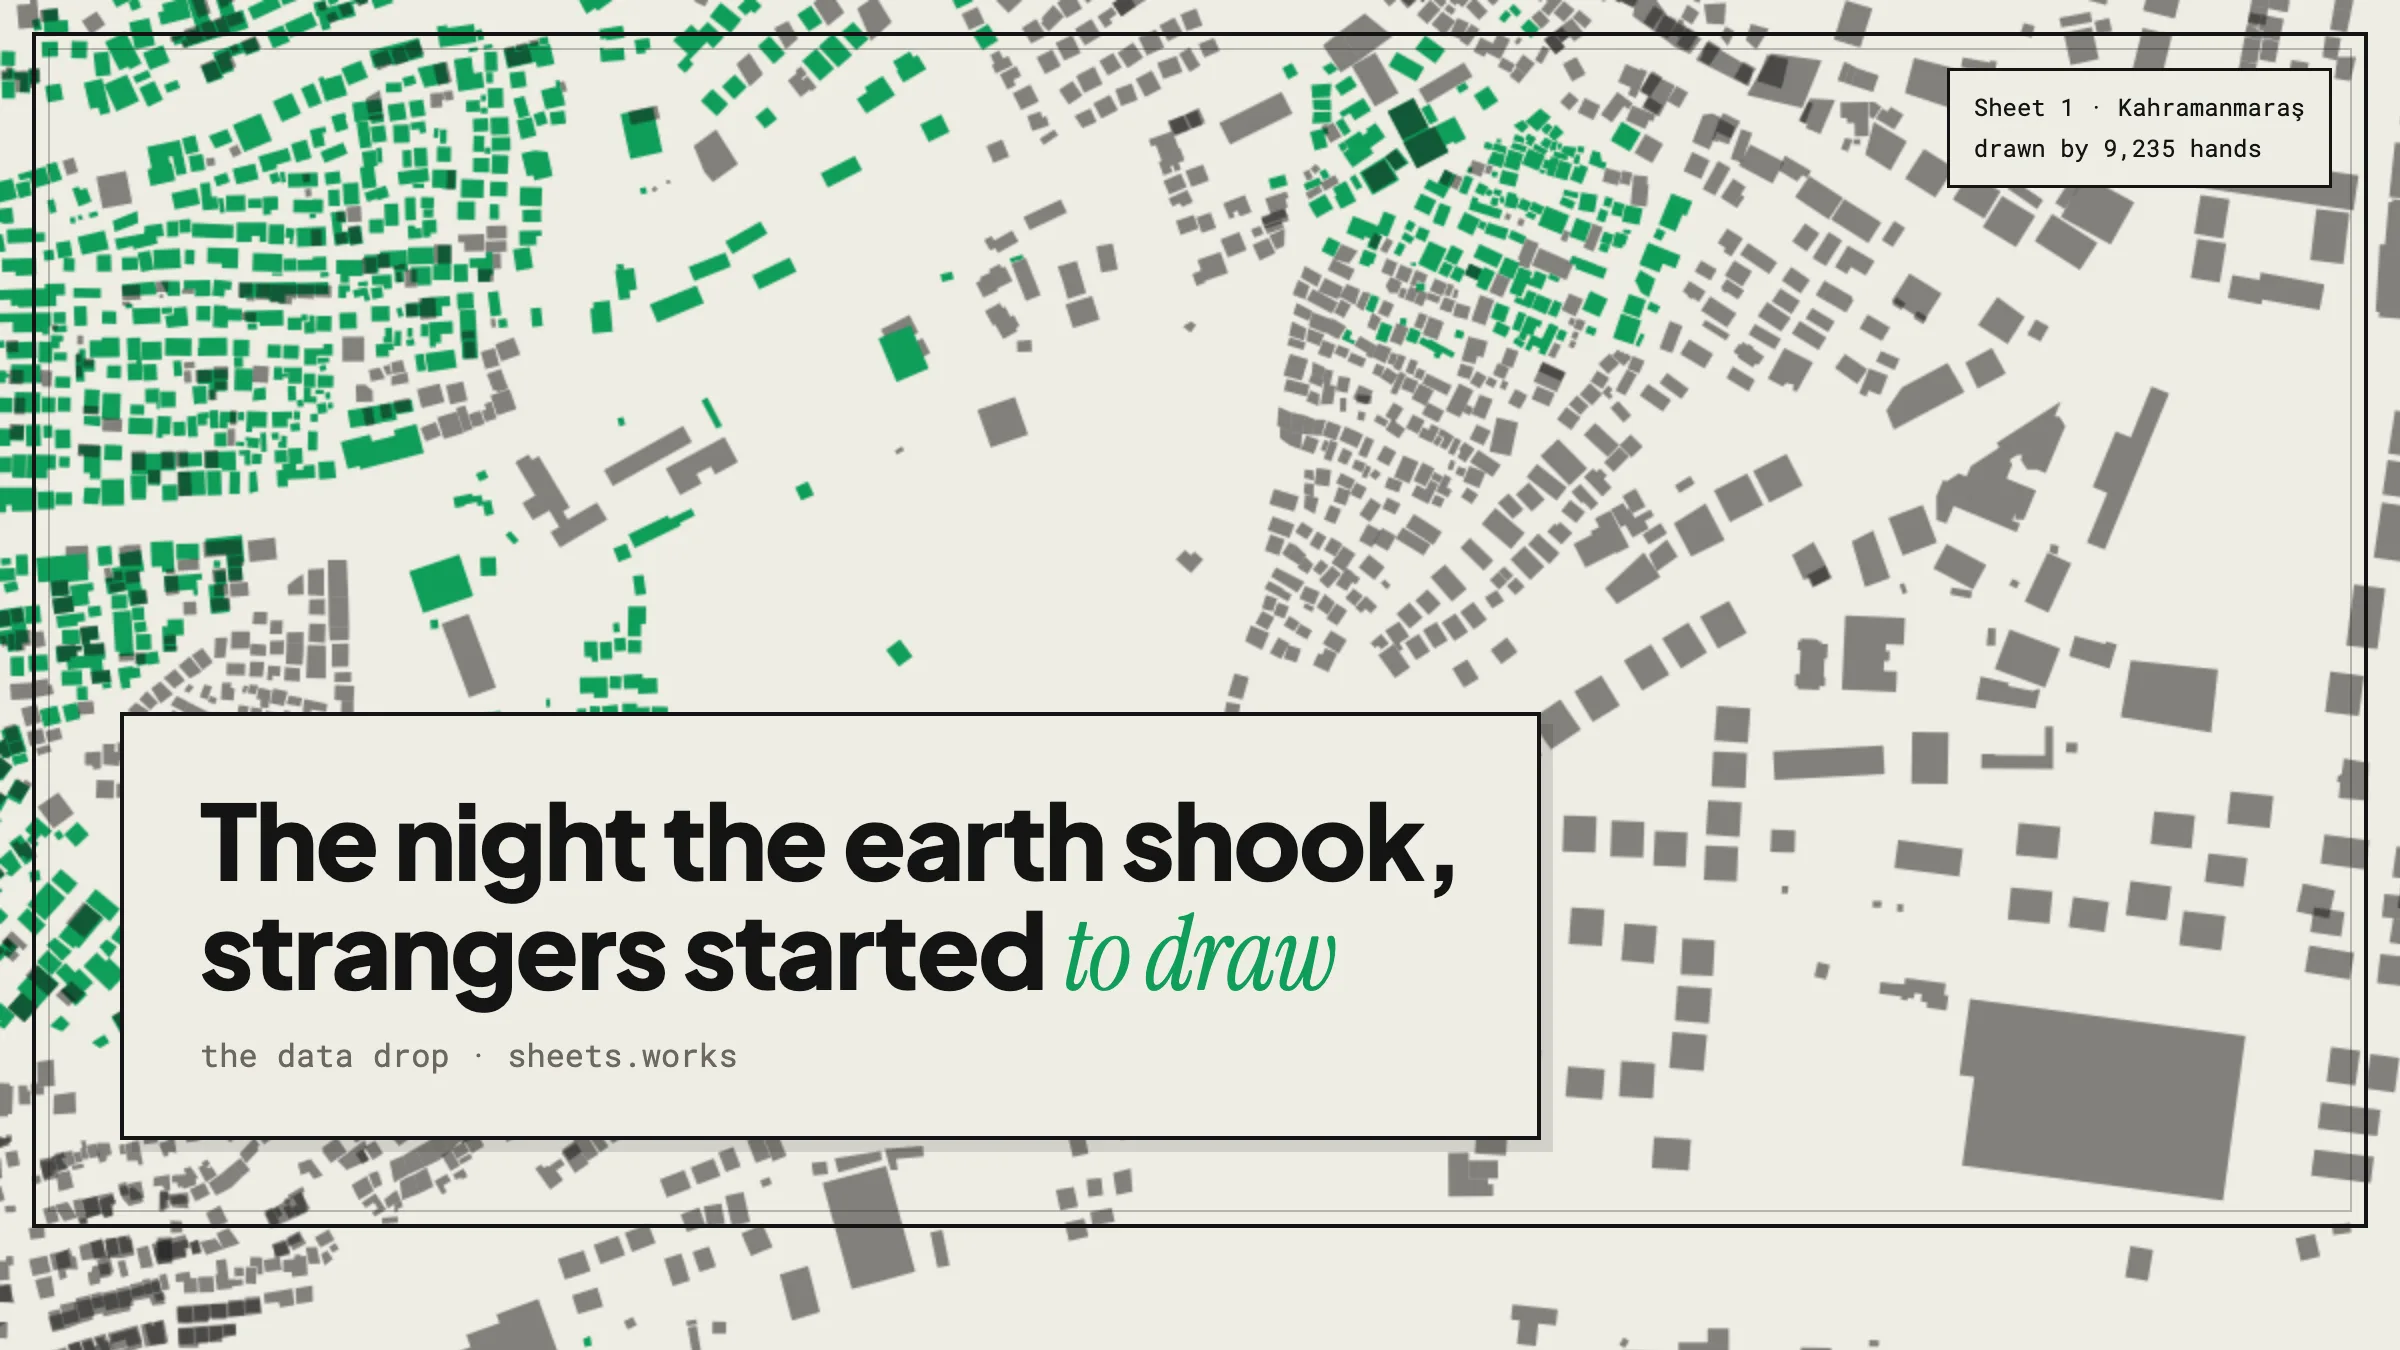
The night the earth shook, strangers started to draw
An earthquake, a blank map, and 9,235 strangers tracing rooftops for rescuers they will never meet.
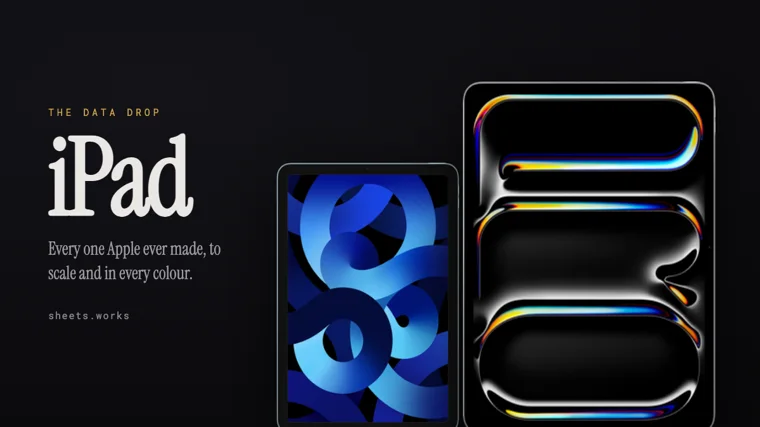
Every iPad, to scale
Sixteen years. Forty-five models.
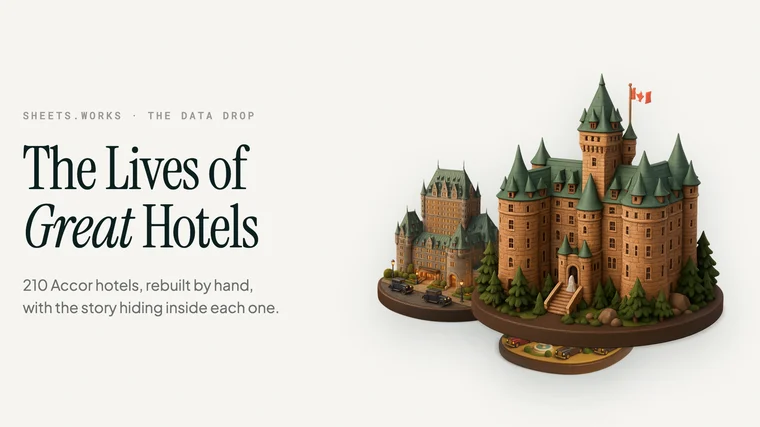
The Lives of Great Hotels
No one builds a great hotel. Time does.
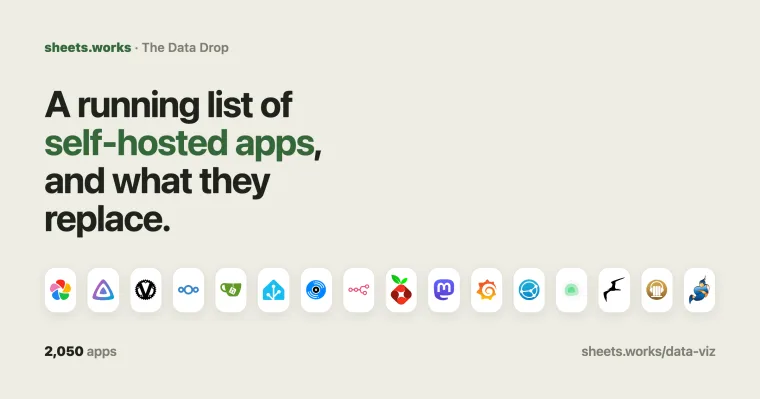
The Self-Hosted Index
A running list of self-hosted apps, and what they replace.
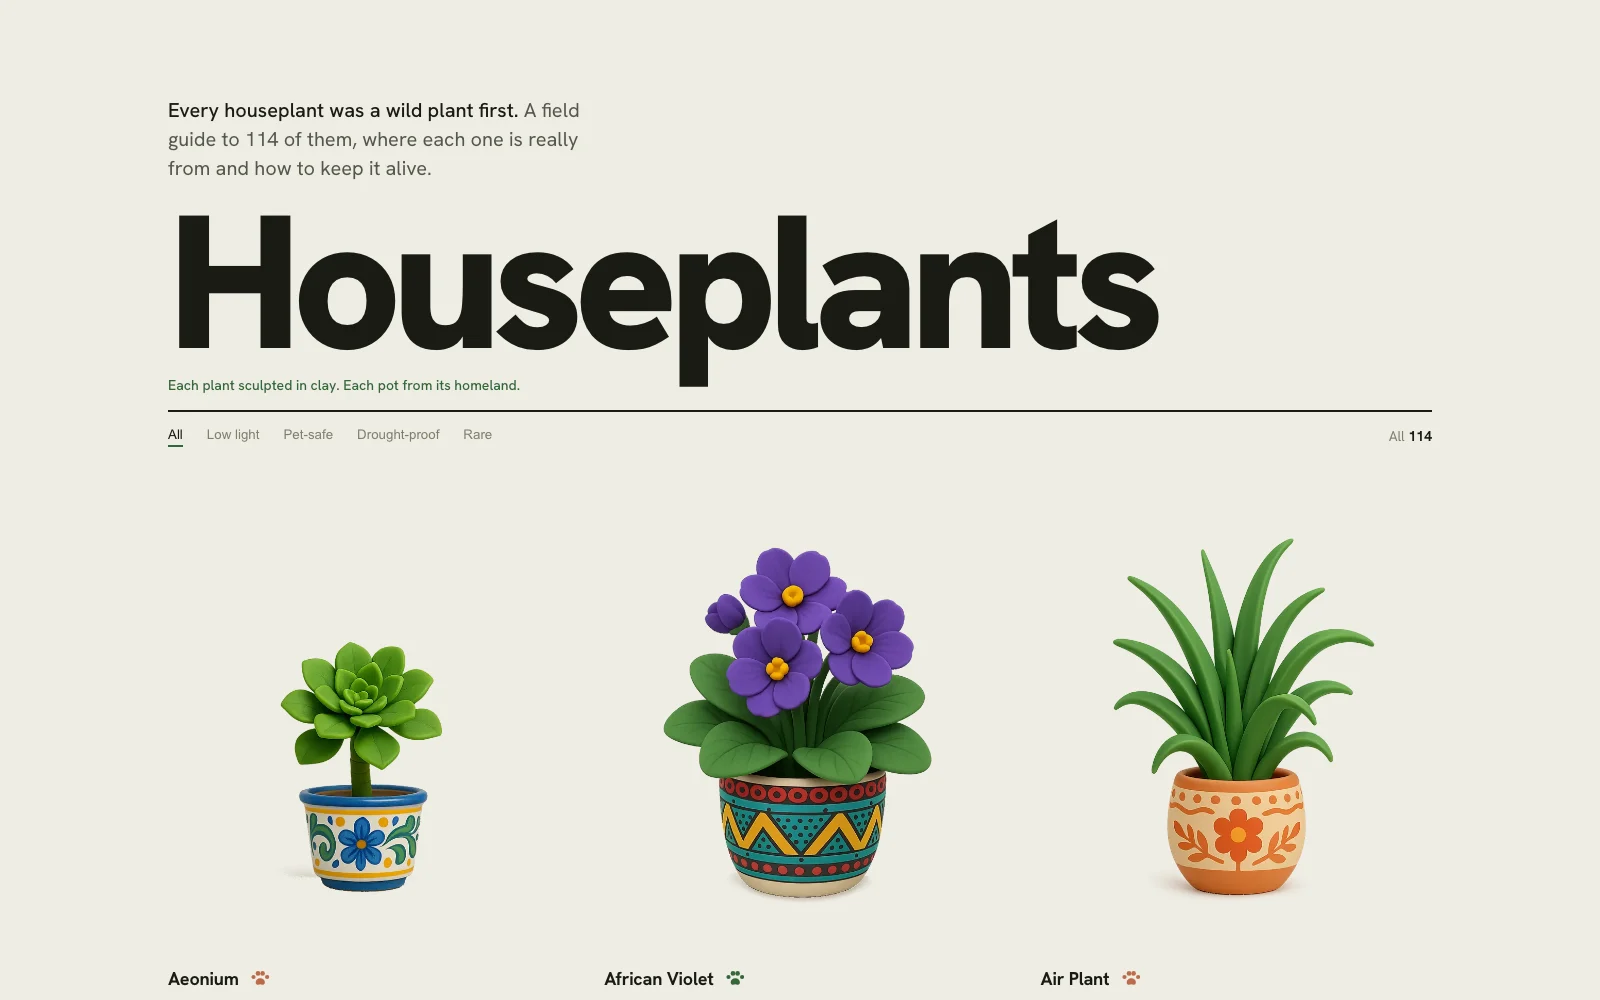
The Houseplant Atlas
Every houseplant was a wild plant first. A field guide to 114 of them, each sculpted in clay, each pot from its homeland: where it comes from, how to keep it alive, and what it's worth.
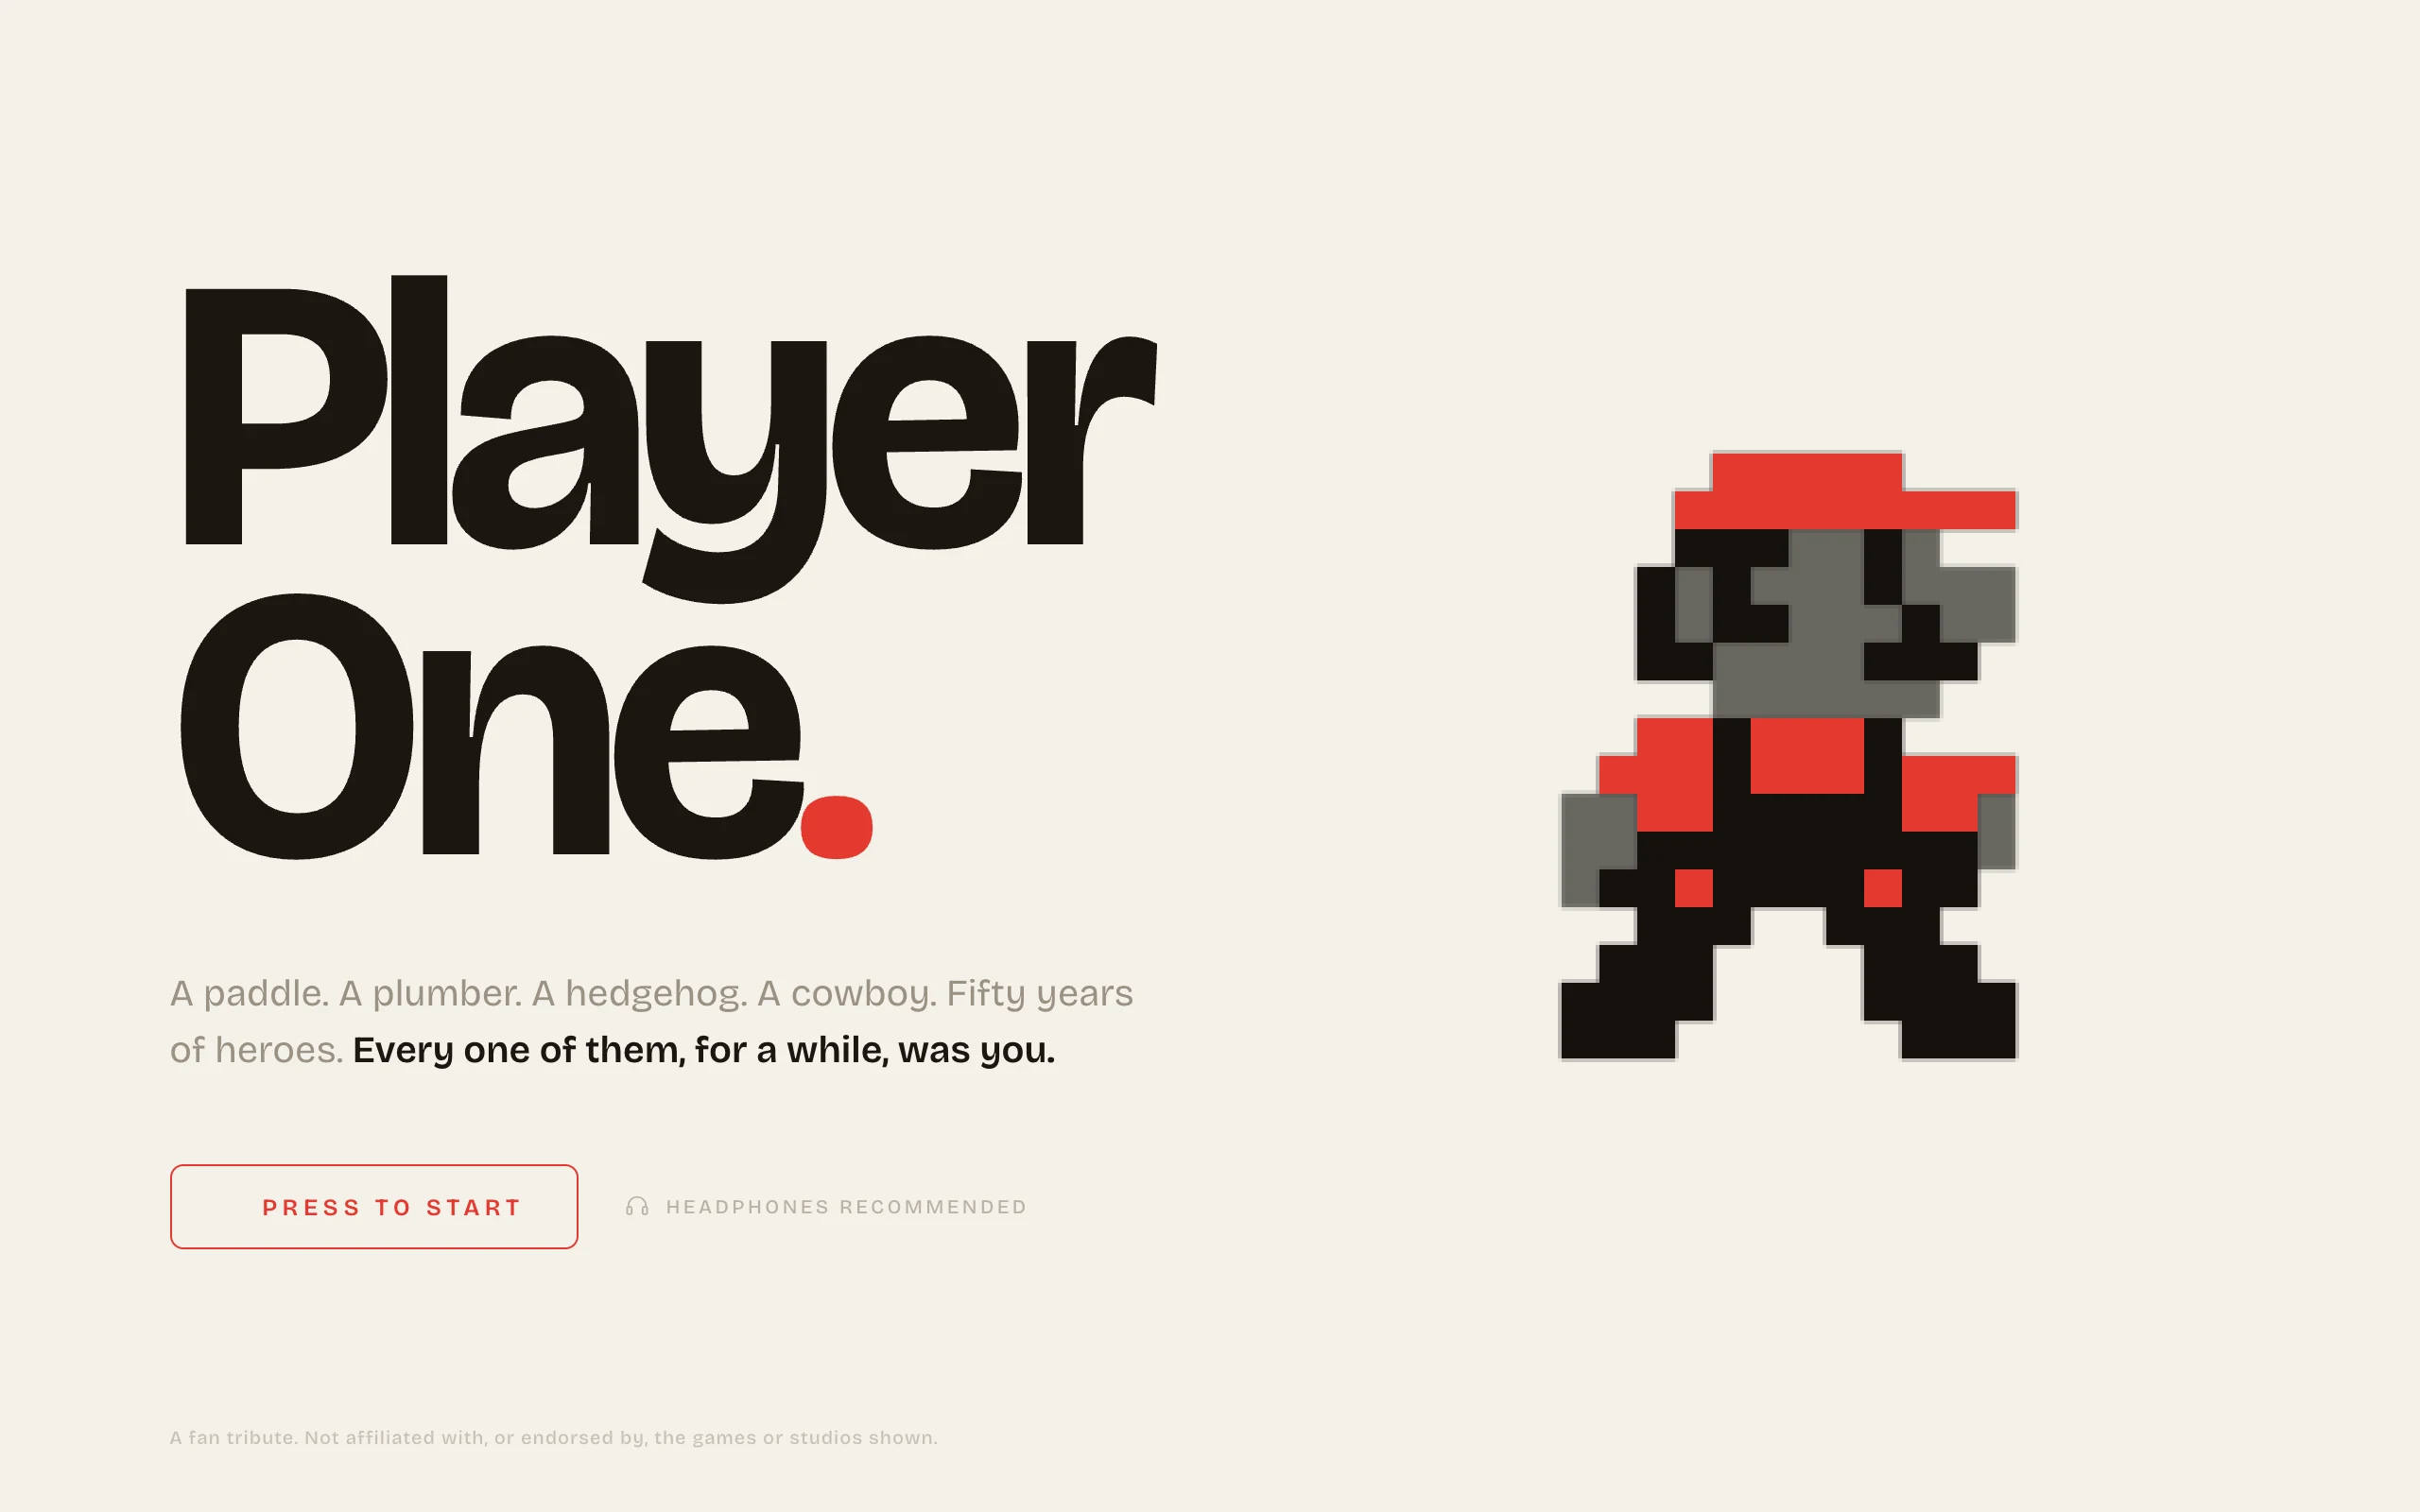
Player One
Fifty years of video game heroes, one per game, from Pong to GTA VI. Each with a true story and its real theme to play. Every one of them, for a while, was you.
Semicolon
A printer drew it in 1496. Now it holds together our language, our code, and the whole digital world; the most important little mark you never think about.
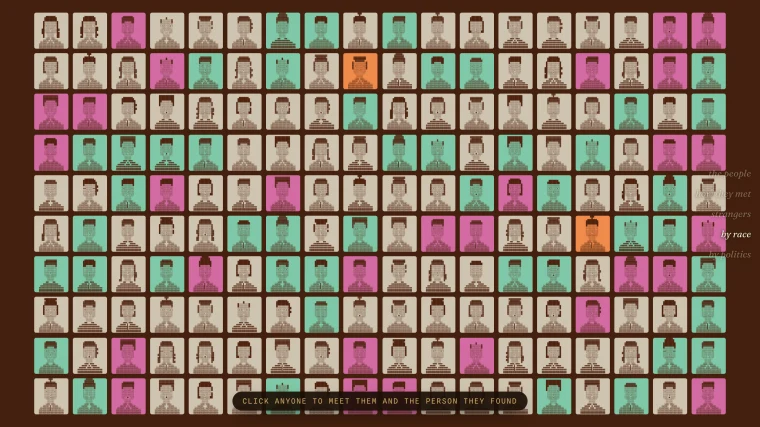
No one introduced us
Two strangers an ocean apart, that no one could have set up. The swipe quietly became the most powerful matchmaker in history.
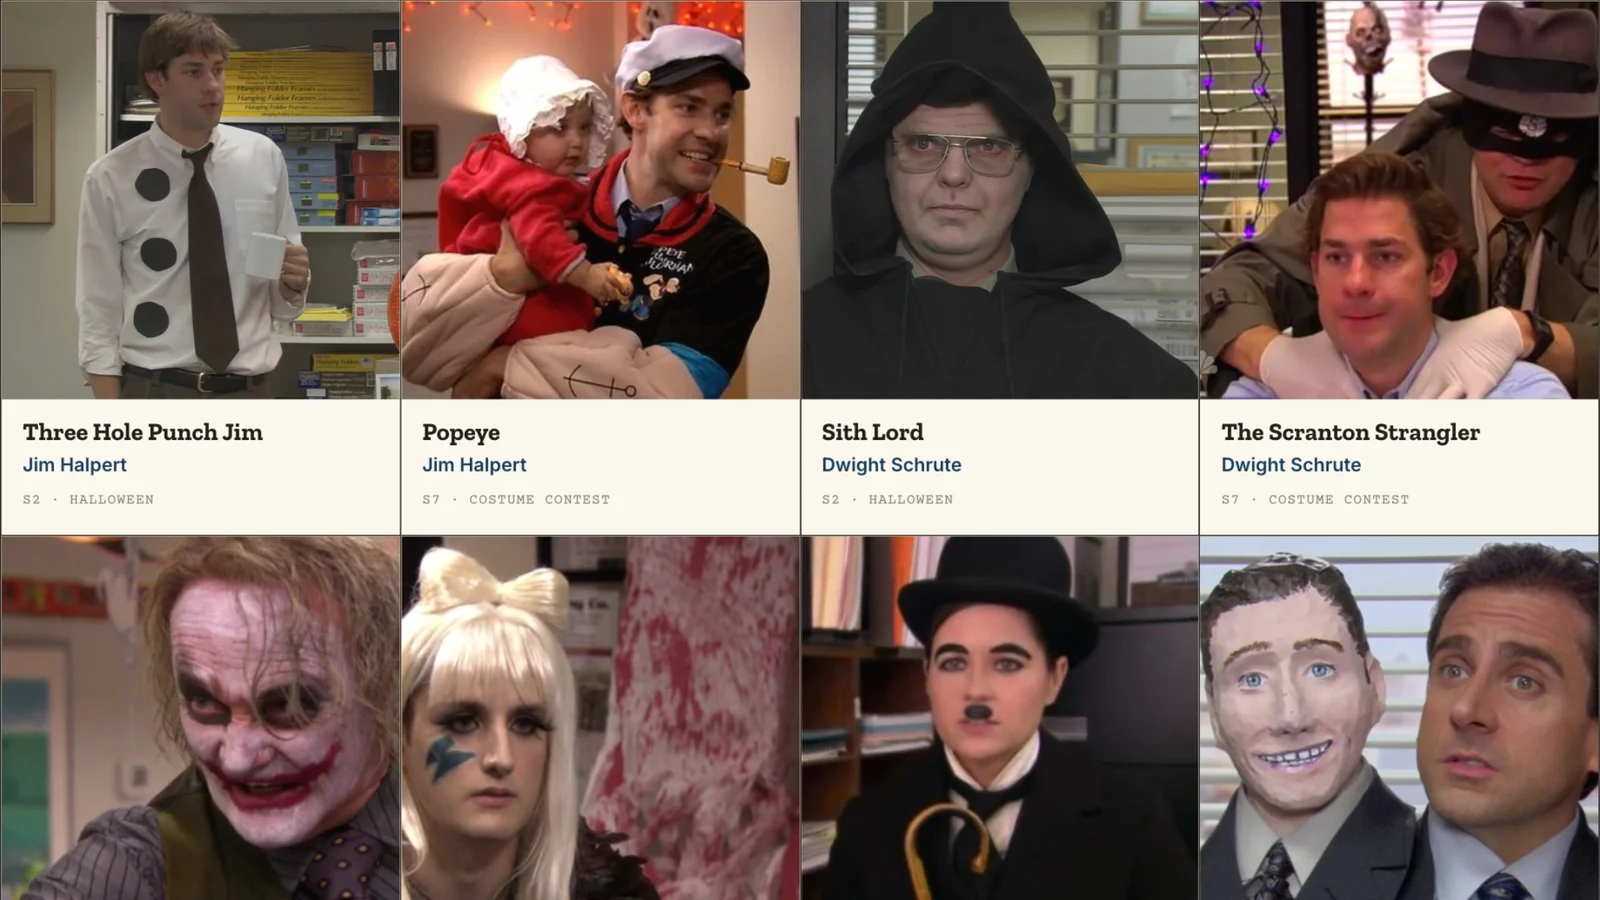
The Costume Contest
Every great Office Halloween costume, on one ballot. Vote for the best, and watch a winner emerge.
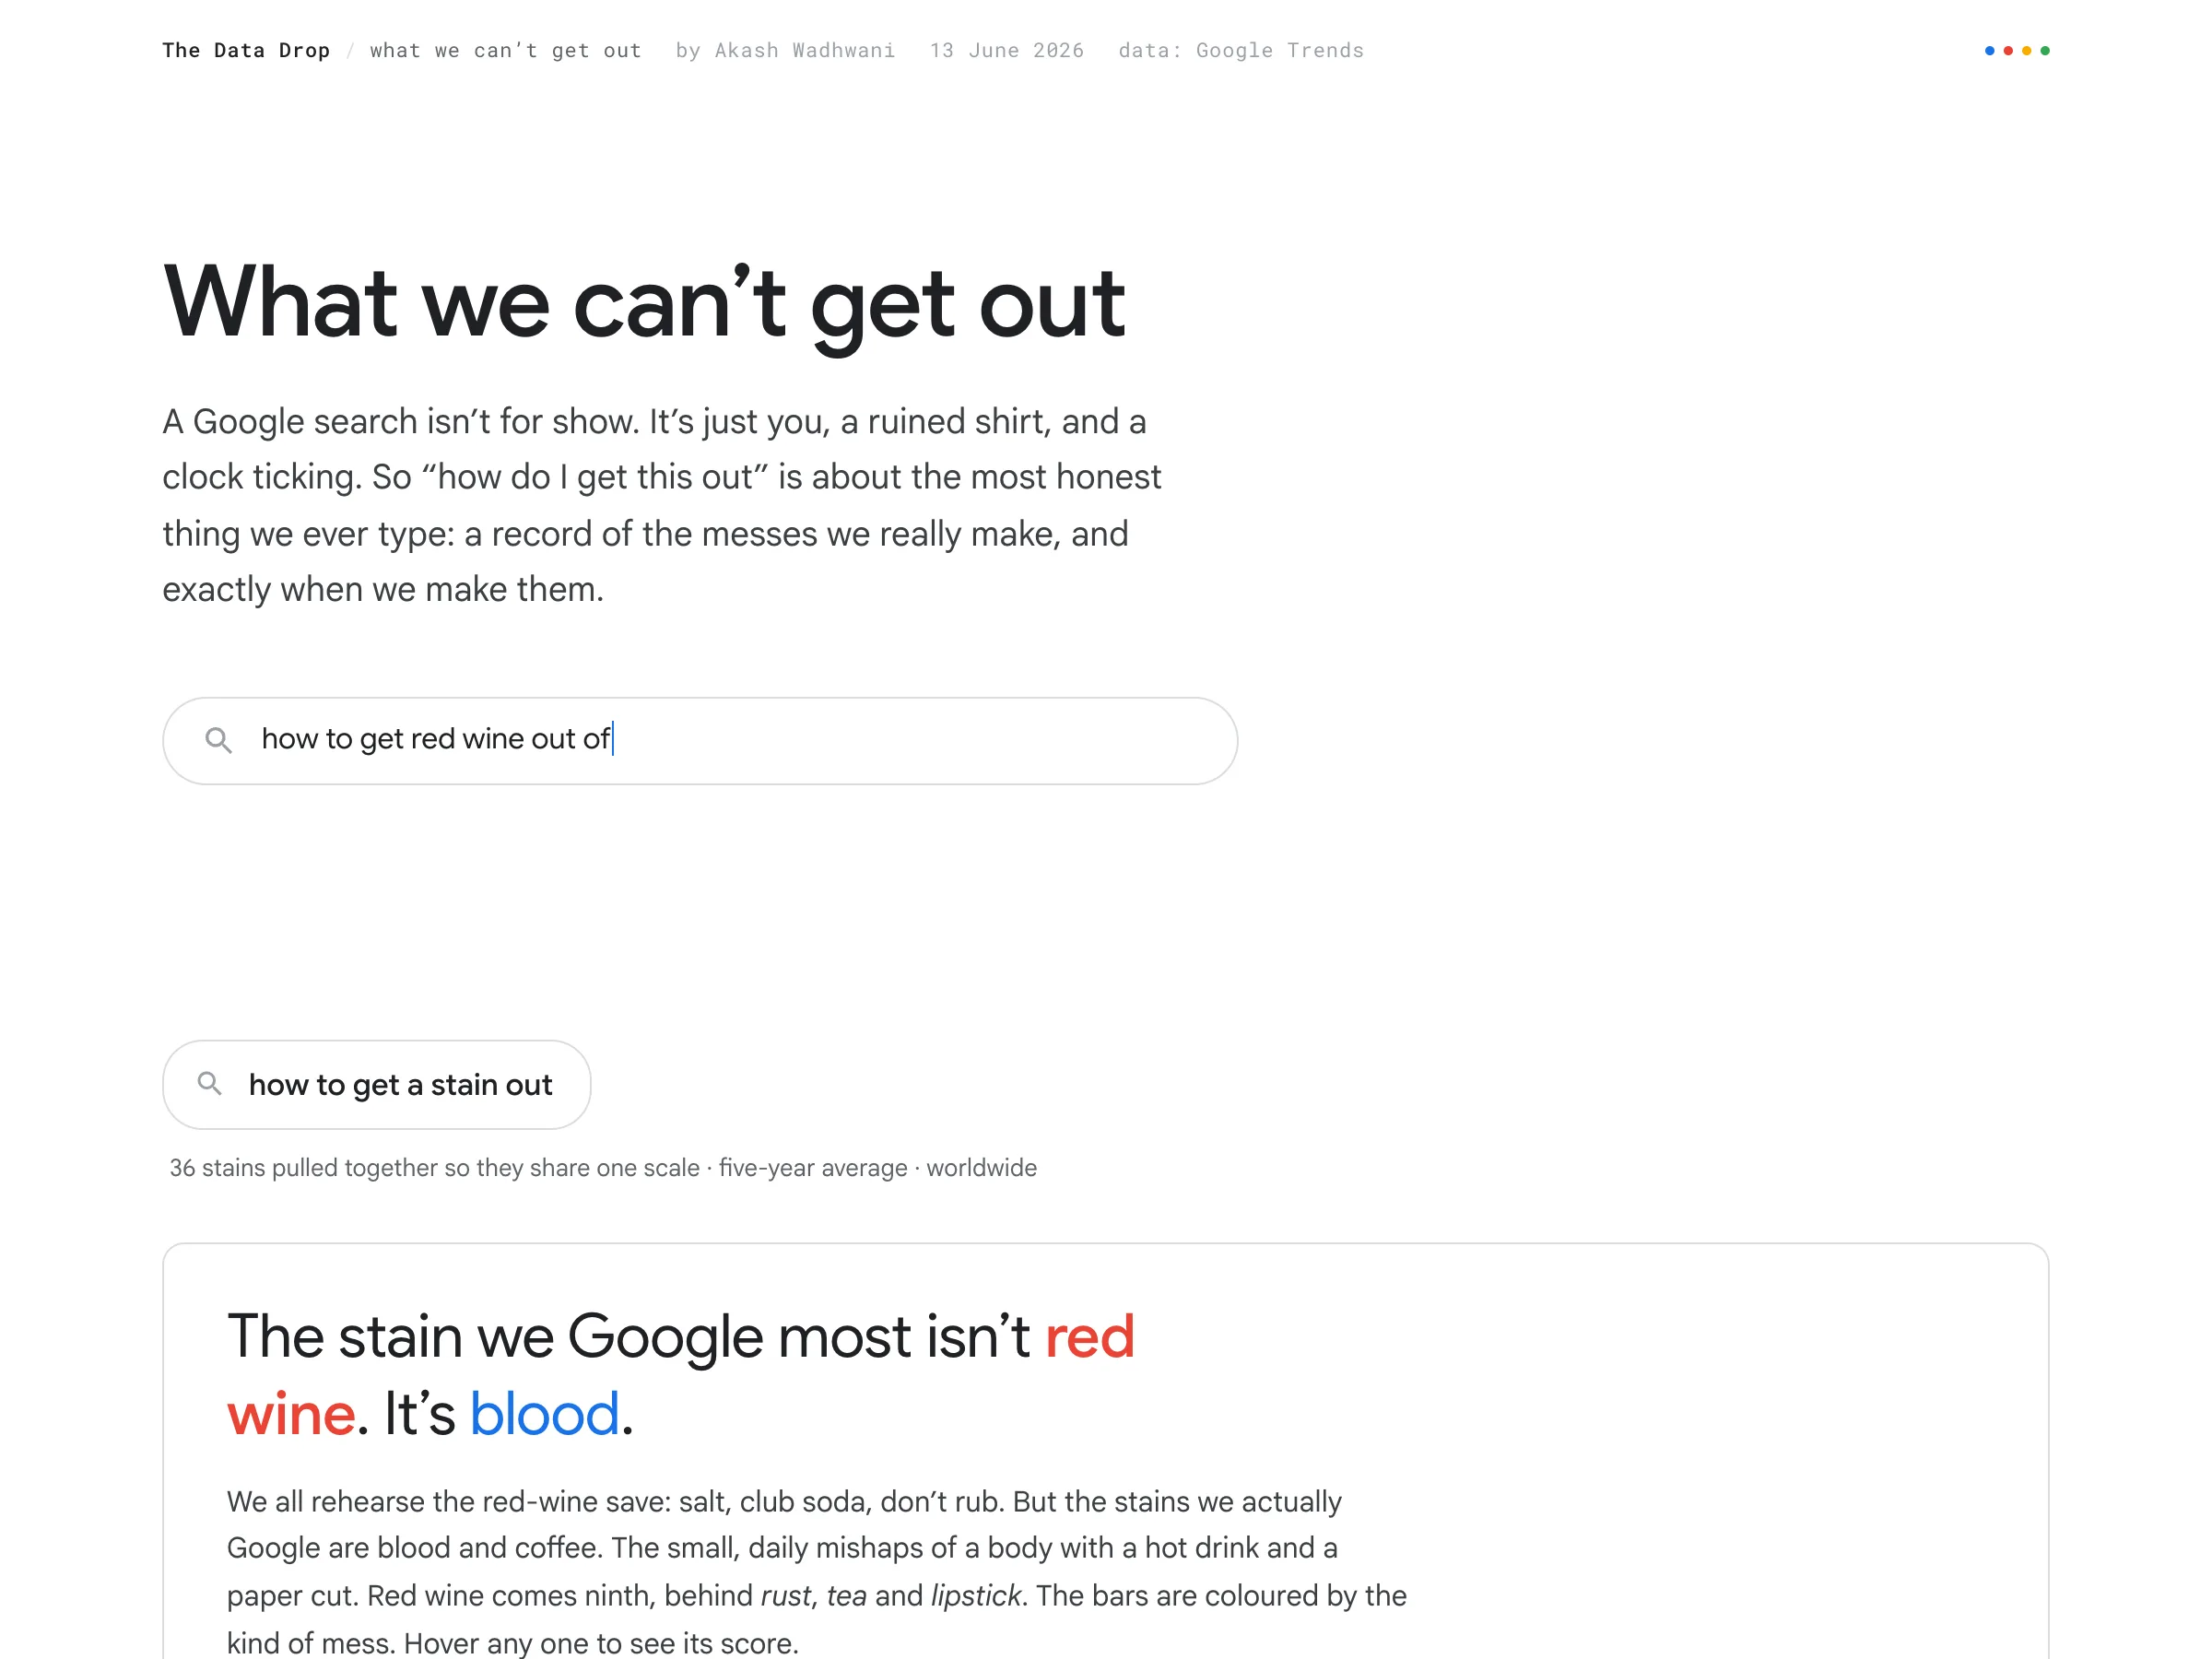
What we can't get out
Five years of stain searches, ranked. It isn't red wine. It's blood. And mess keeps a calendar.
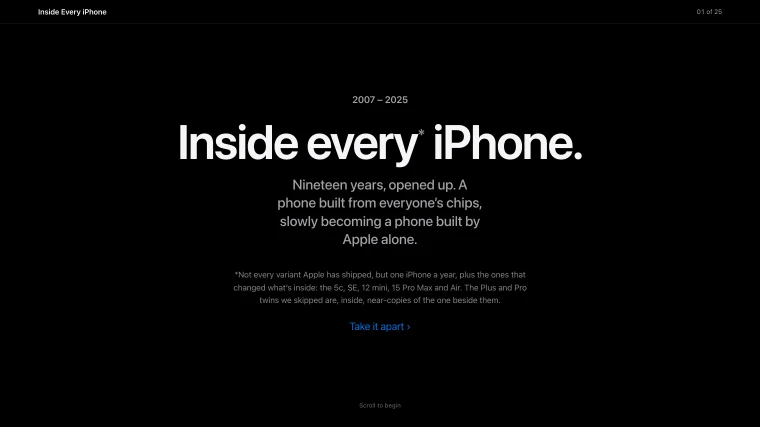
Inside Every iPhone
Nineteen years of teardowns: a phone built from everyone's chips, slowly built by Apple alone.

Indian Railways, 1853–2026
Every line India built since 1853, on one map, including the day the network was cut in two.
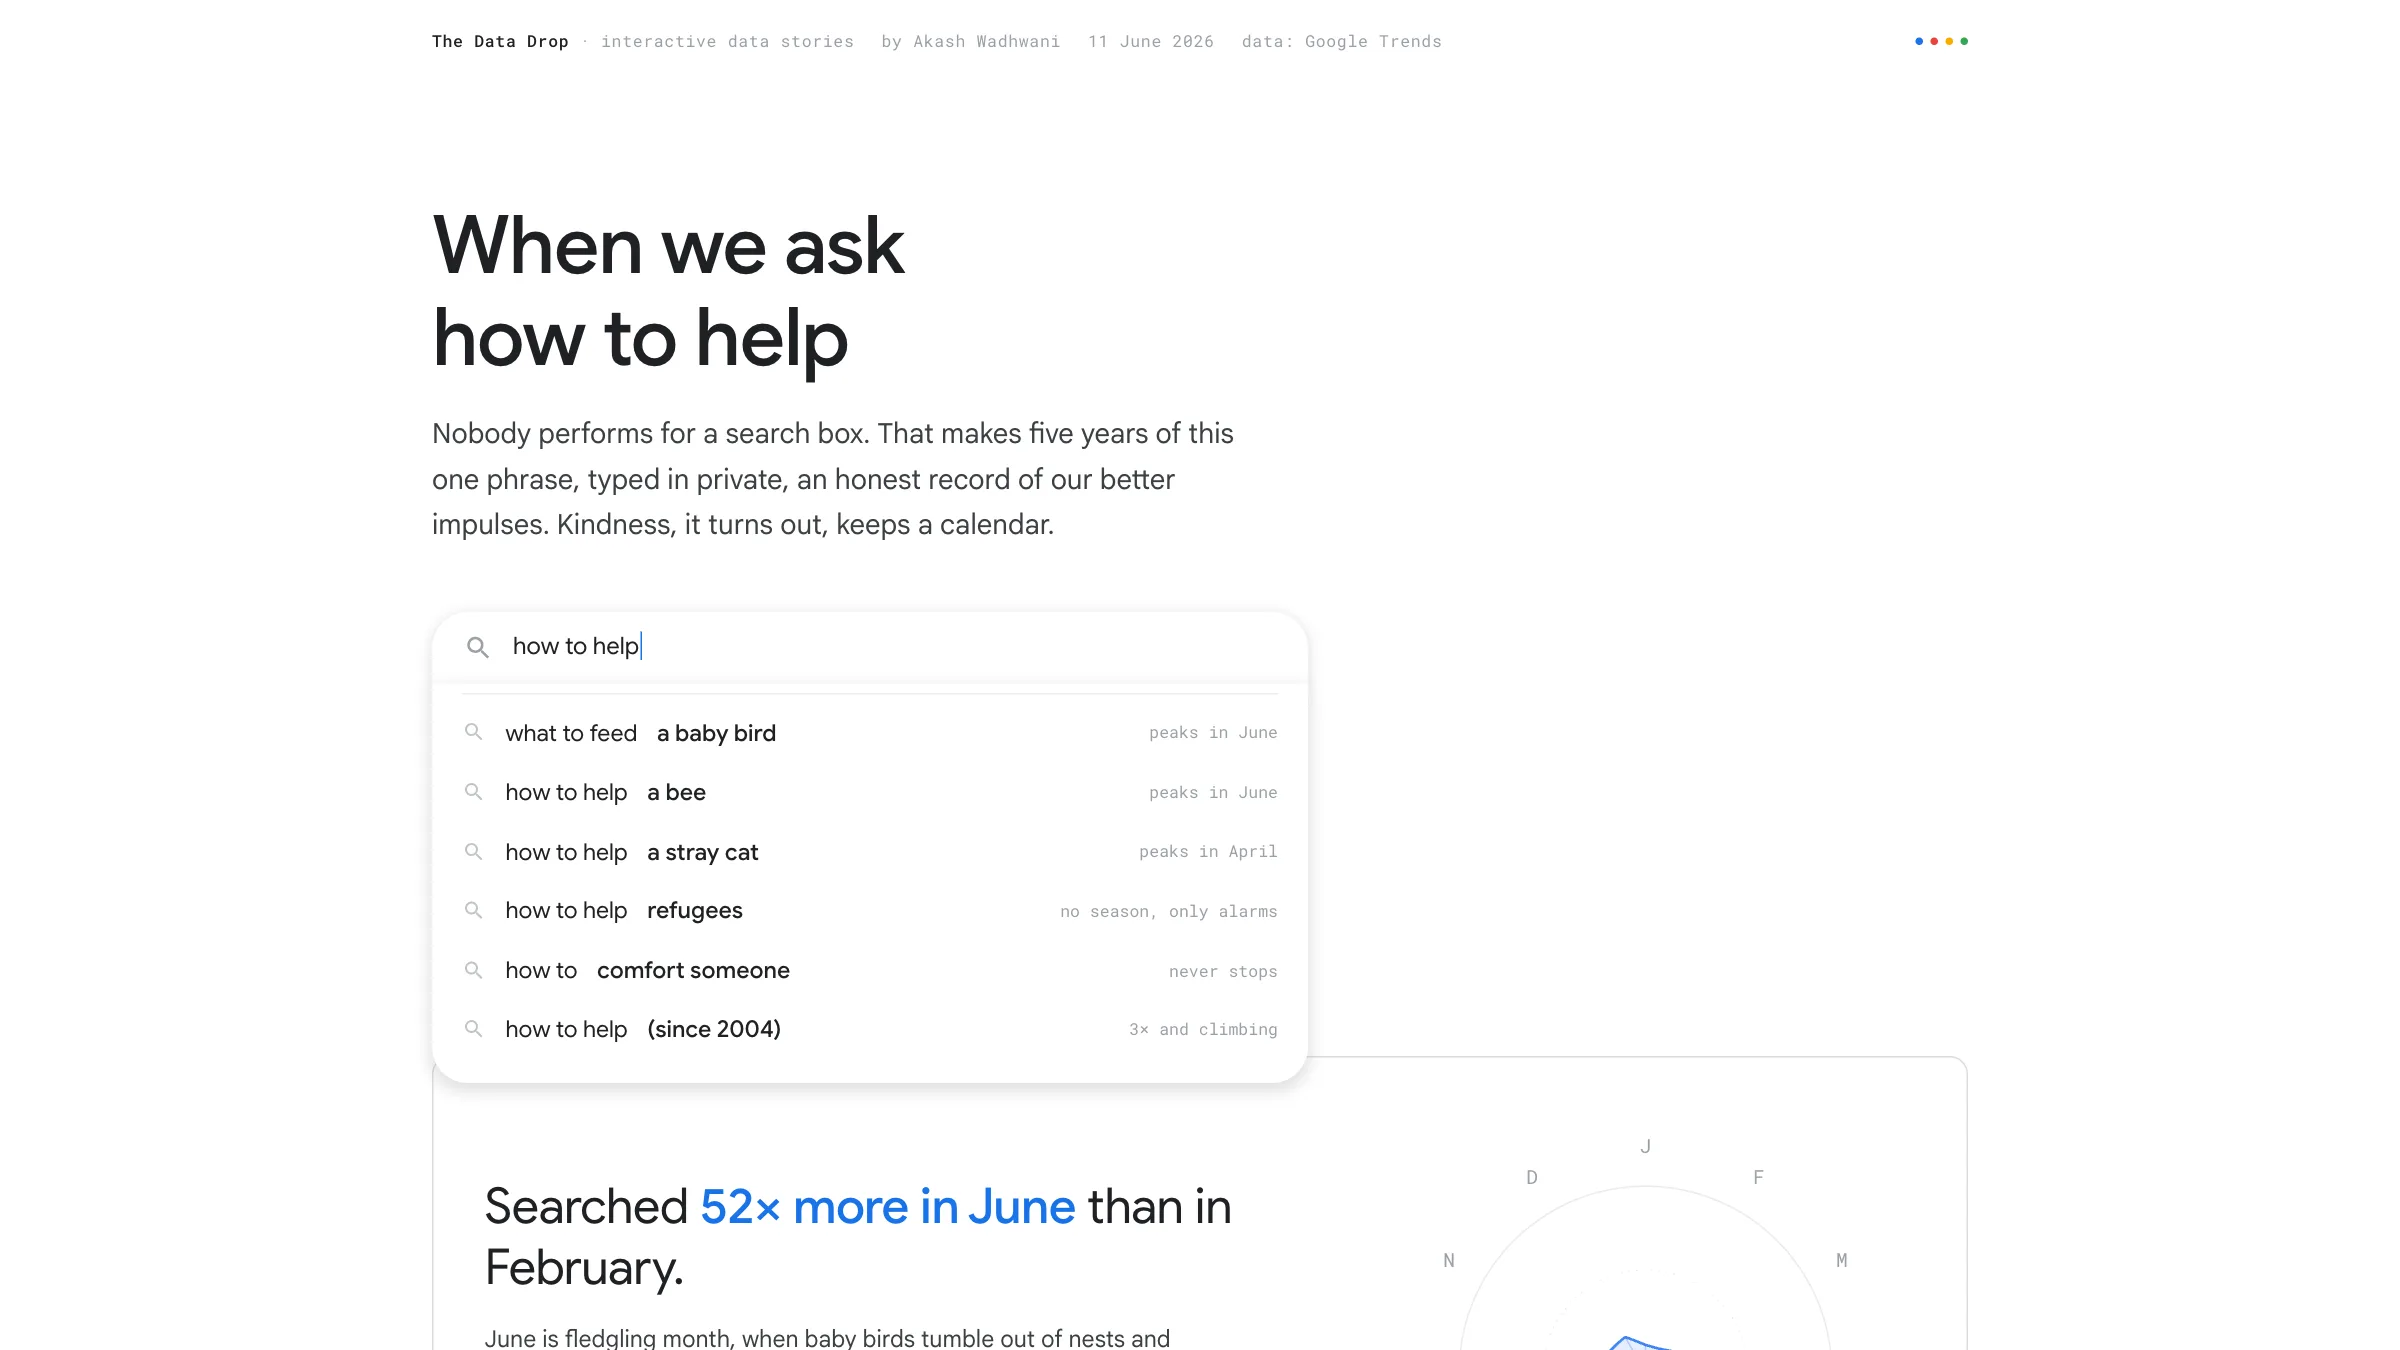
When we ask how to help
Five years of searches about helping, wound into circles. Kindness keeps a calendar.
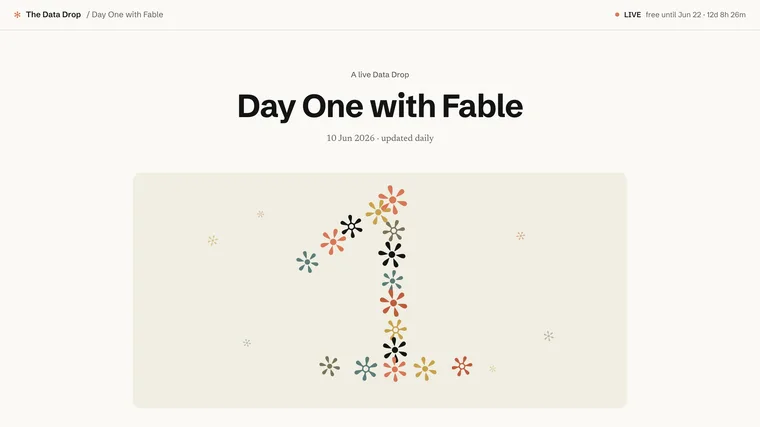
Day One with Fable
A live, metered diary of Claude Fable 5. Vibes elsewhere, receipts here.
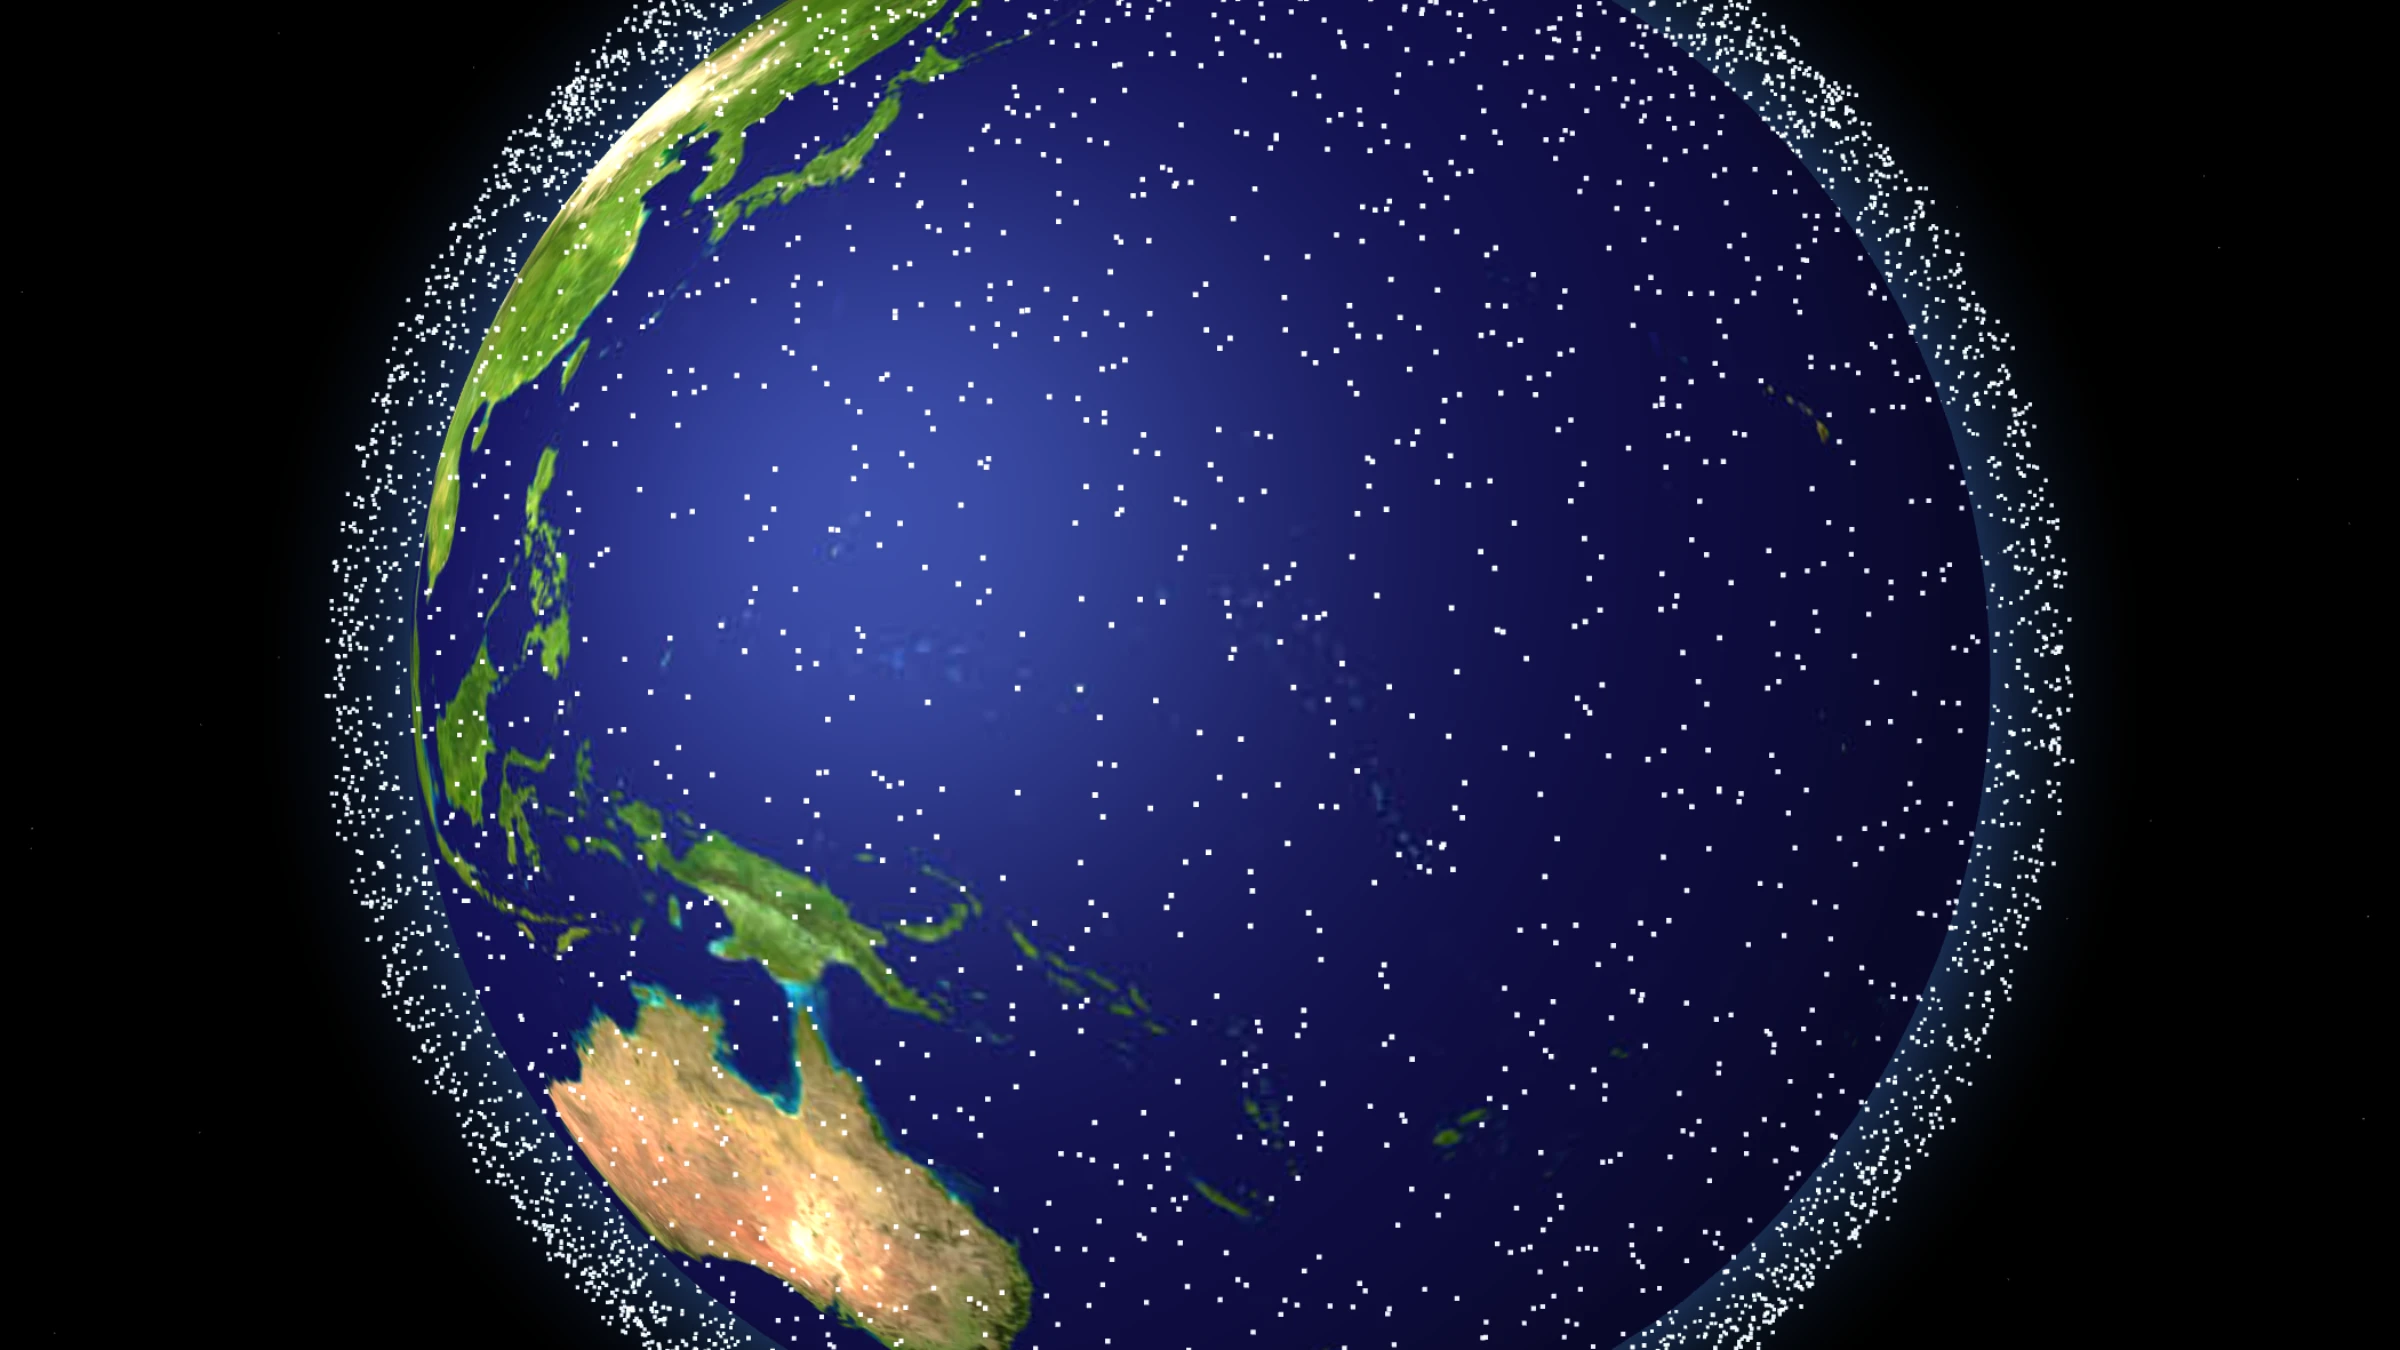
Every Starlink, orbiting now
A live, spinnable map of all 10,495 satellites SpaceX has in orbit.
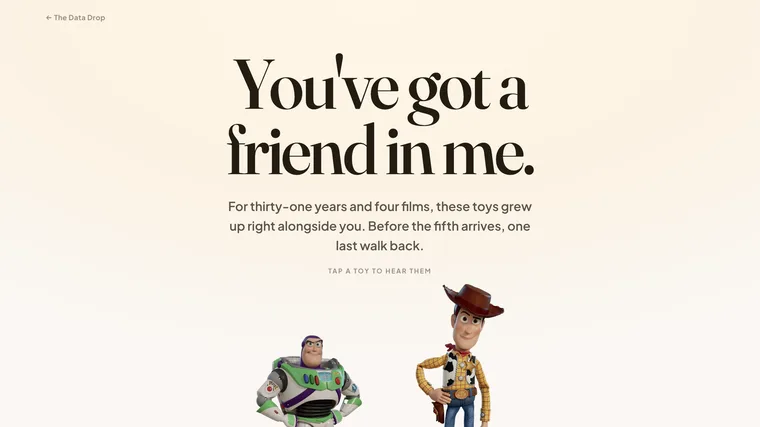
You've got a friend in me
For 31 years and four films, the toys grew up with you.
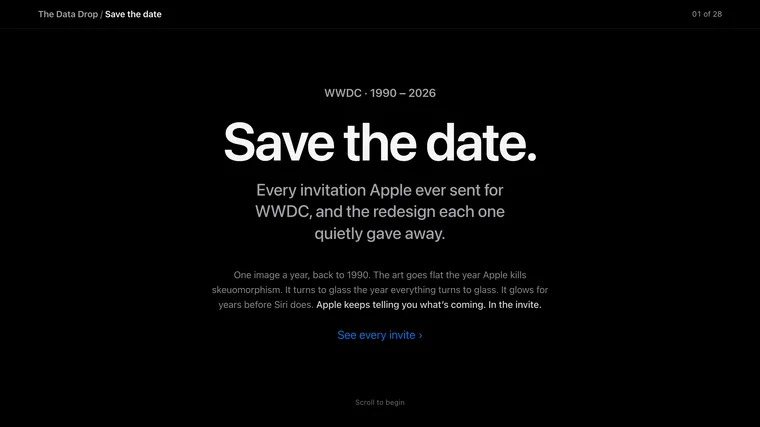
Save the date
Every invitation Apple ever made for WWDC, 1990 to 2026.
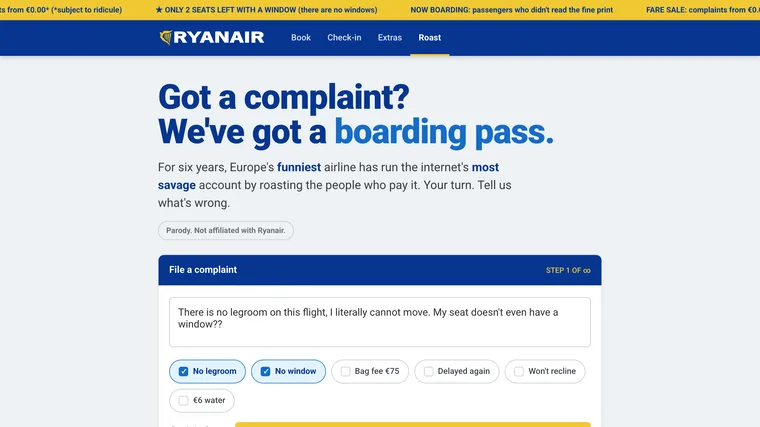
Ryanair's Roast
File a complaint and Europe's funniest airline issues you a boarding pass to ROASTED, seat 11A….
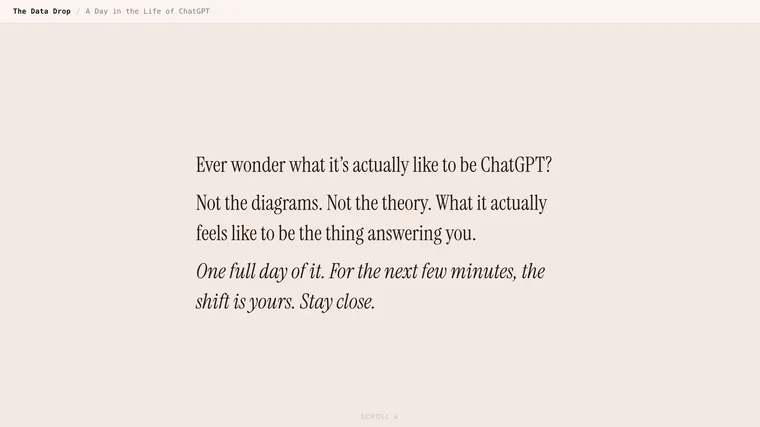
A Day in the Life of ChatGPT
Not the diagrams.
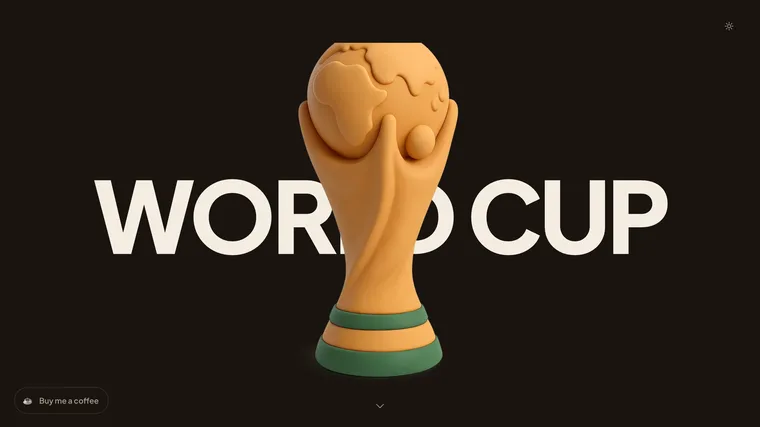
The World Cup, in clay
Every team, every stadium, every match of the 2026 World Cup, built in clay and data.
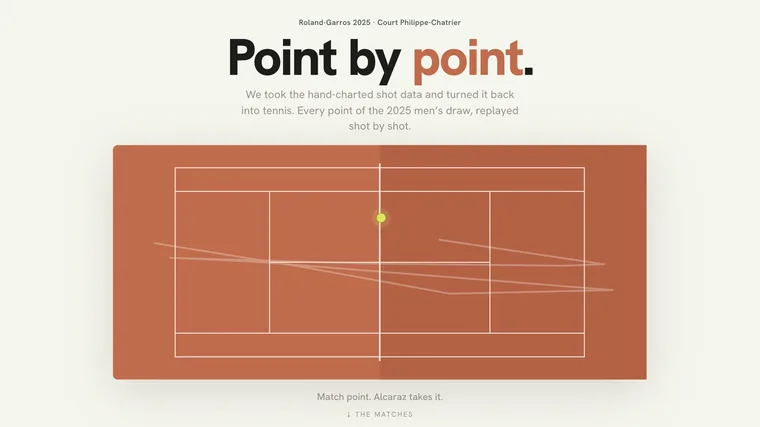
Roland-Garros 2025, point by point
The whole men's draw, replayed shot by shot on the clay.
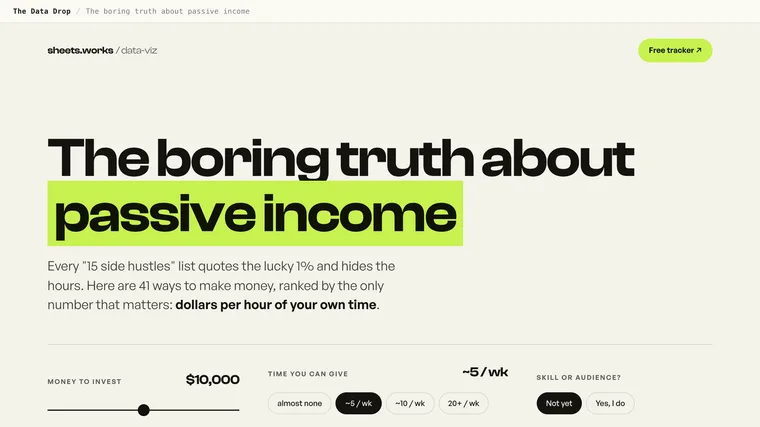
The Boring Truth About Passive Income
Every "15 side hustles" list quotes the lucky 1% and hides the median.

Slurp
A bowl.

The Bells of Tokyo
Every Tokyo platform plays a different seven-second song.
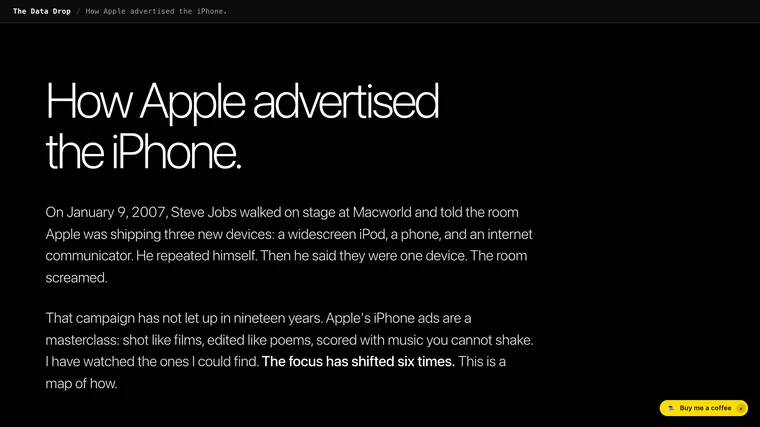
iPhone ads are a masterclass
Shot like films, edited like poems, scored with music you can't shake.
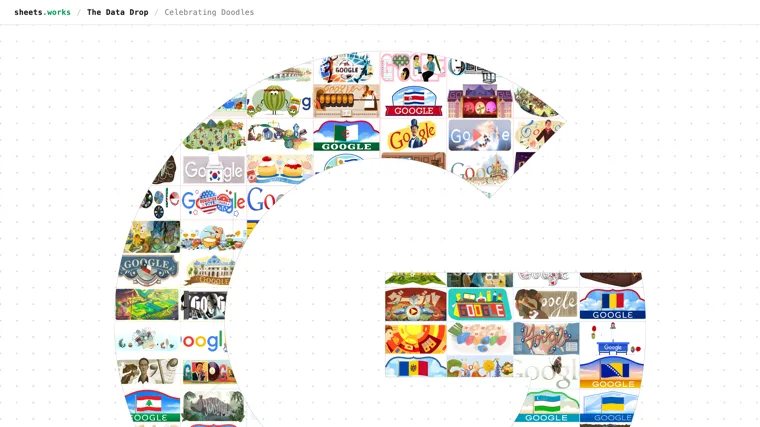
Celebrating Doodles
6,342 times Google redrew its own logo to honor a person, a holiday, a discovery. A tribute to the Doodles, and the artists who sign almost none of them.
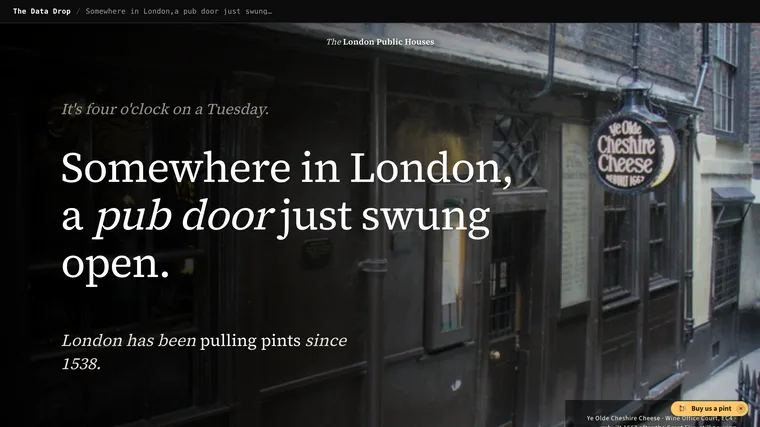
The London Public Houses
London's pubs, photographed and mapped.
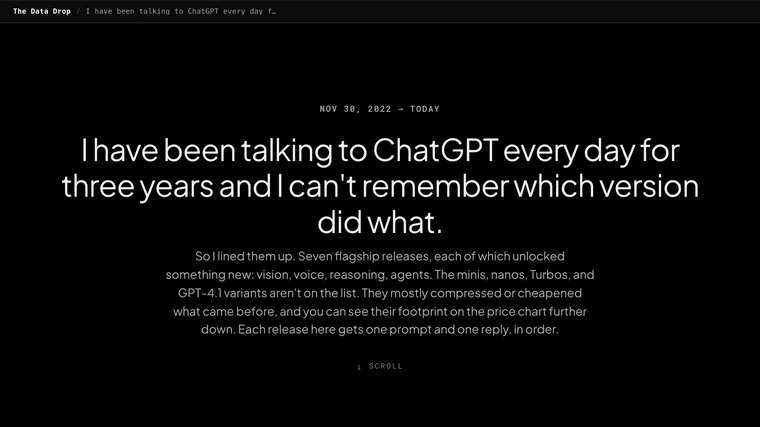
Every ChatGPT
From the refusal era in 2022 to GPT-5 today.
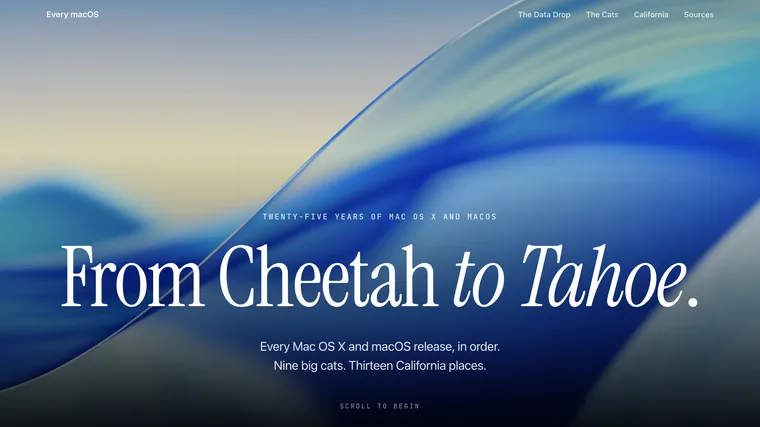
Every macOS
Nine big cats.
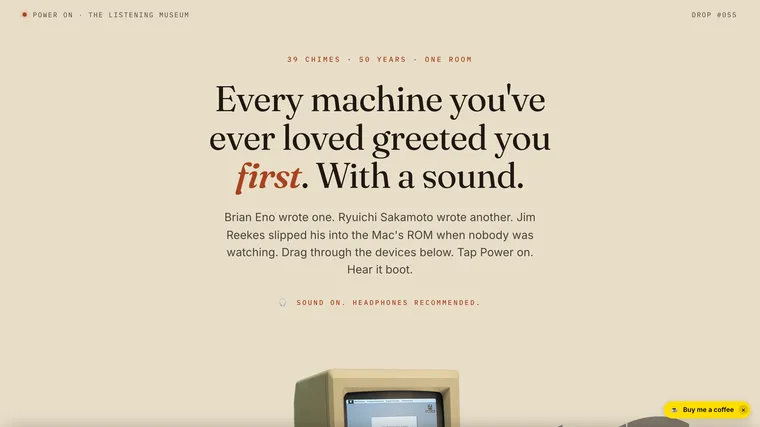
Power On
Brian Eno wrote one.
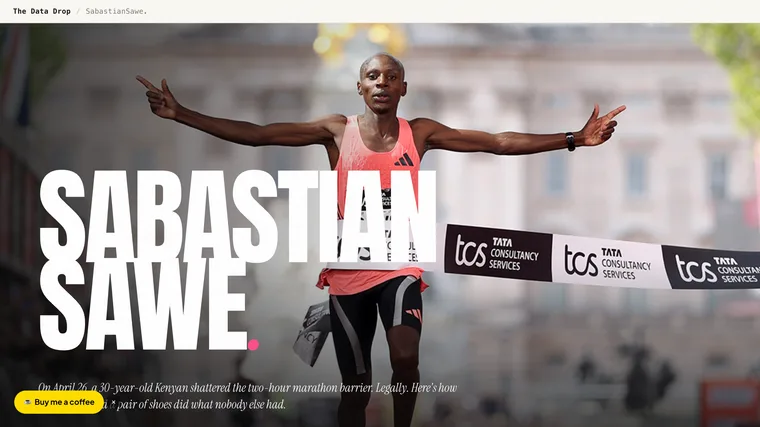
Sub Two
On April 26, a 30-year-old Kenyan shattered the two-hour marathon barrier in a 97-gram shoe.
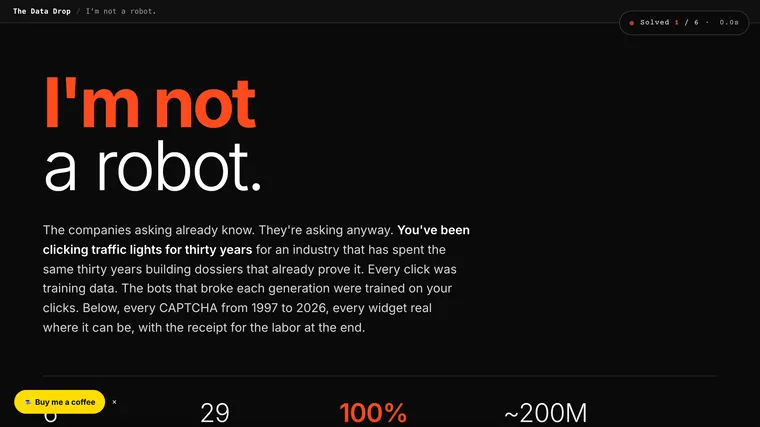
I'm not a robot
The companies asking already know.
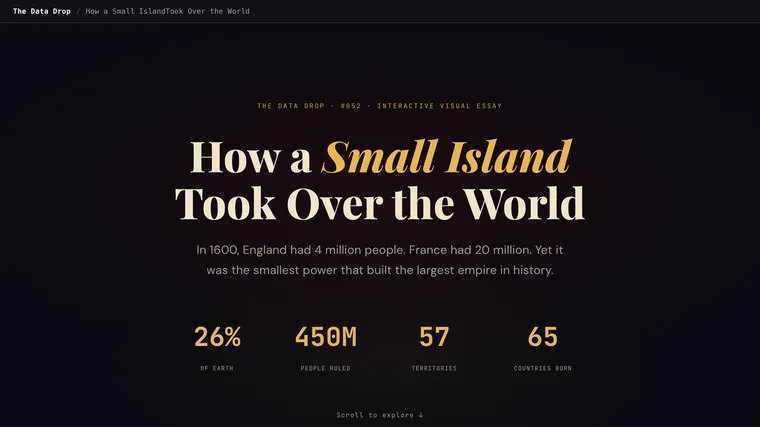
How a Small Island Took Over the World
England had 4 million people.
A Visual History of Programming Languages
From Fortran to Mojo.
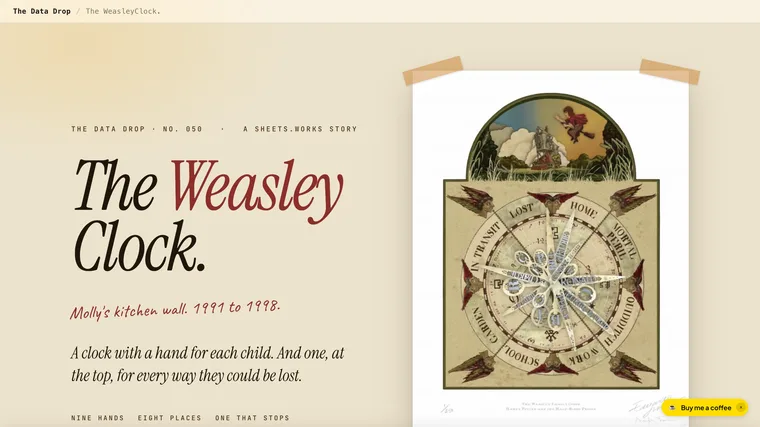
The Weasley Clock
Molly Weasley's kitchen clock had nine golden hands, one for each of her family.
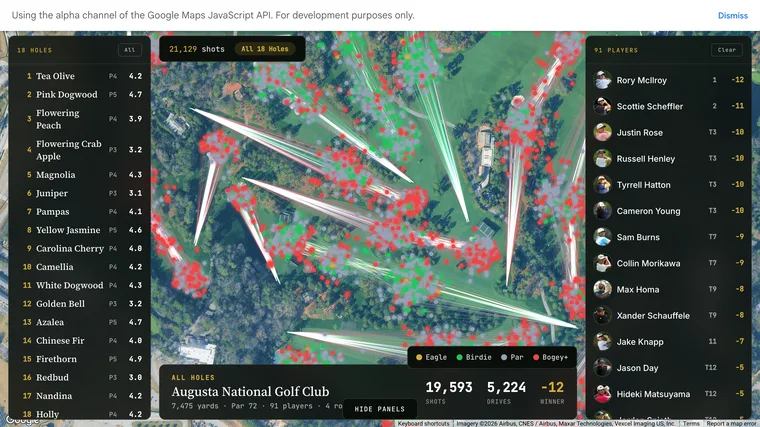
Every Shot at The Masters
Rory McIlroy went back-to-back at Augusta National, beating Scottie Scheffler by one.
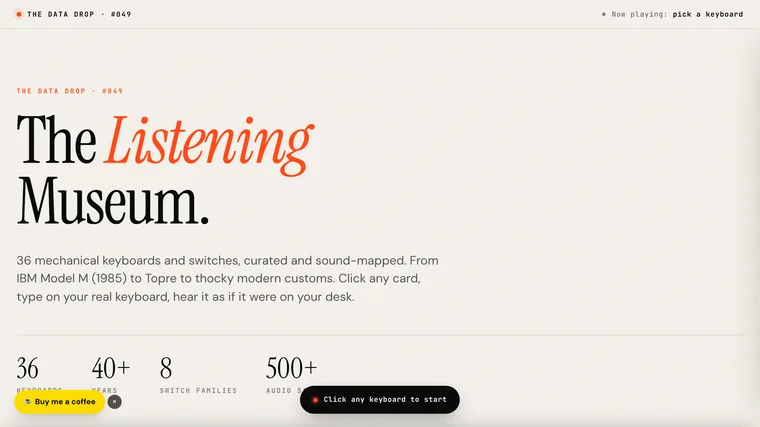
The Listening Museum
36 mechanical keyboards, sound-mapped.
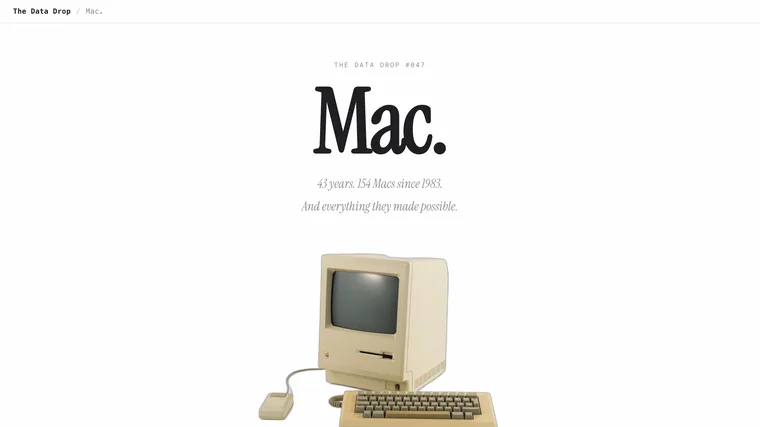
154 Macs Since 1983
43 years.
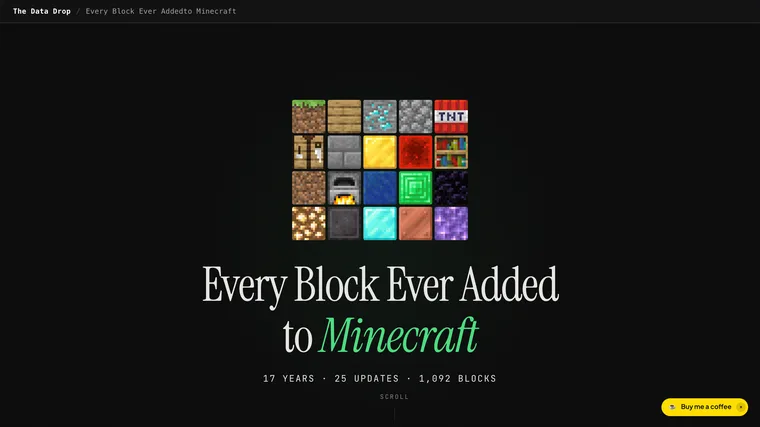
Every Block Ever Added to Minecraft
From 26 blocks in Classic to 1,092 today.
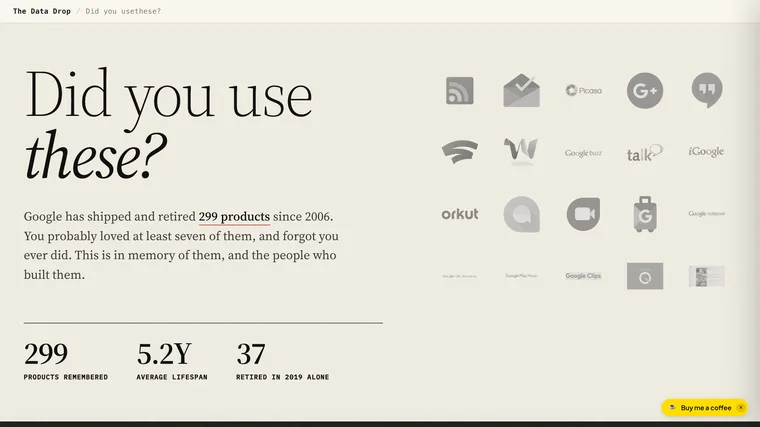
299 Google Products We Remember
Google has shipped and retired 299 products since 2006.
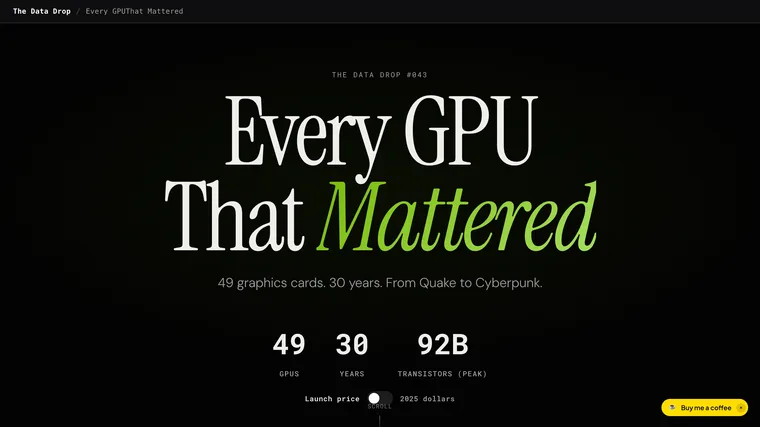
Every GPU That Mattered
49 graphics cards.
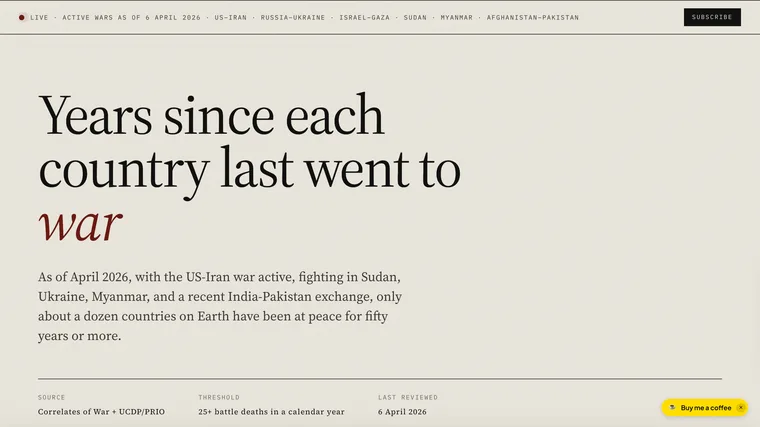
Years Since Each Country Last Went to War
Only about a dozen countries on Earth have been at peace for fifty years or more.
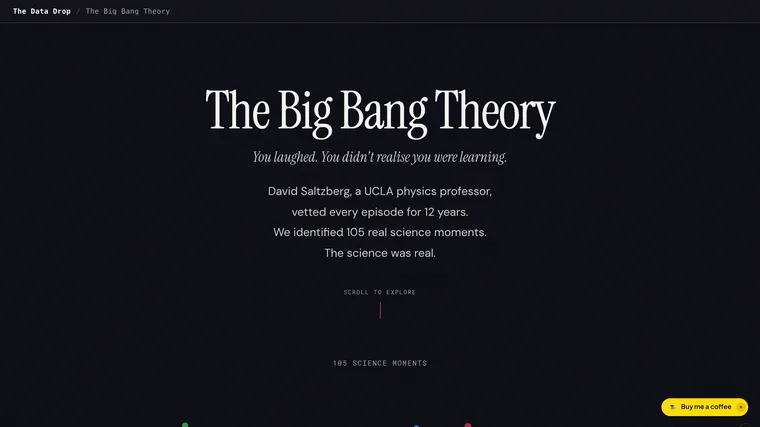
The Big Bang Theory
105 real science moments hidden inside a sitcom.
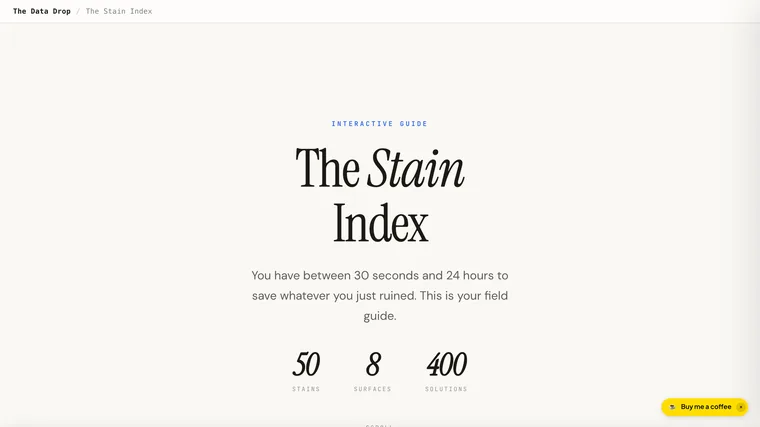
The Stain Index
How to remove anything from anything.
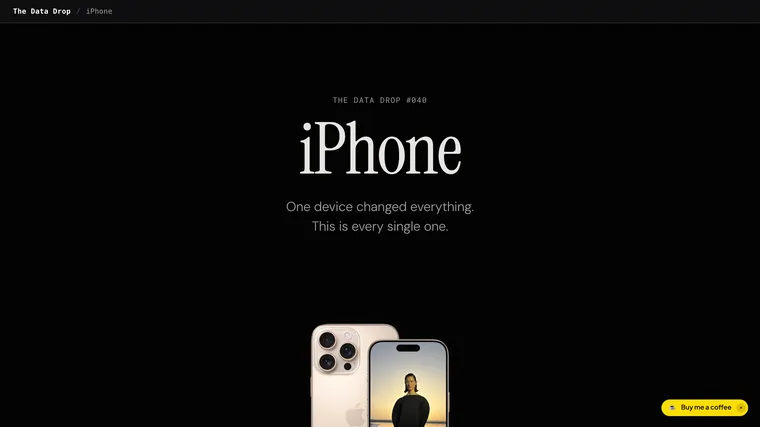
Every iPhone Ever Made
19 years.
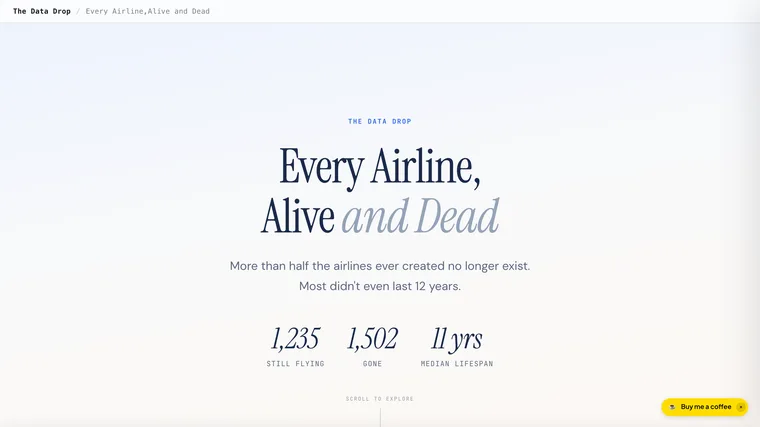
Every Airline, Alive and Dead
Over 2,700 airlines have existed since 1919.
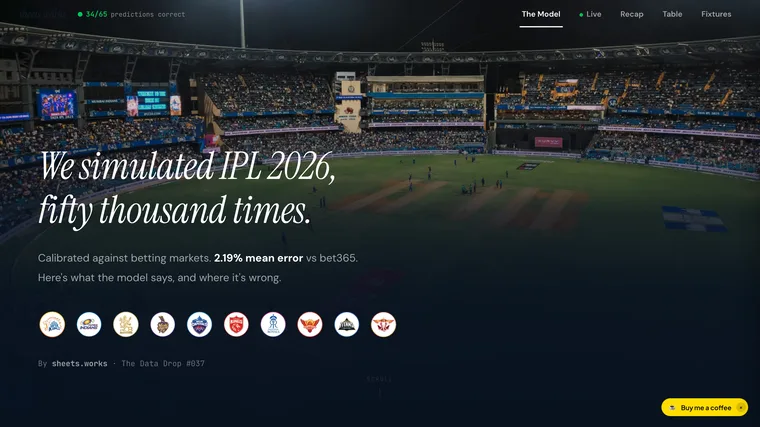
We Simulated IPL 2026 Fifty Thousand Times
Player ratings, match predictions, and team analysis backed by 7,775 T20 matches.
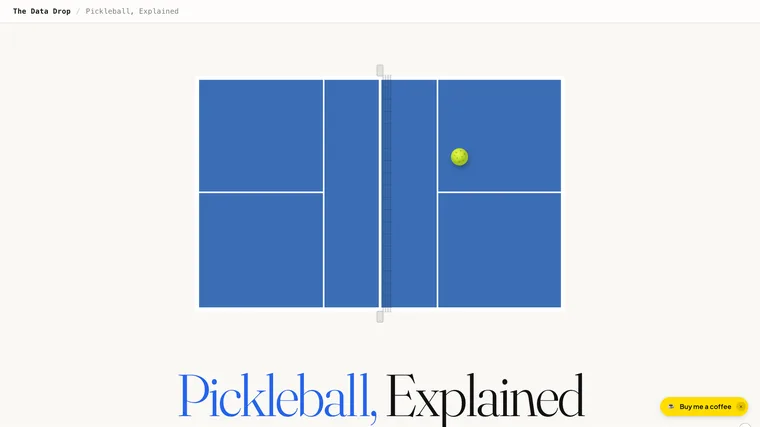
Pickleball, Explained
20M+ players.
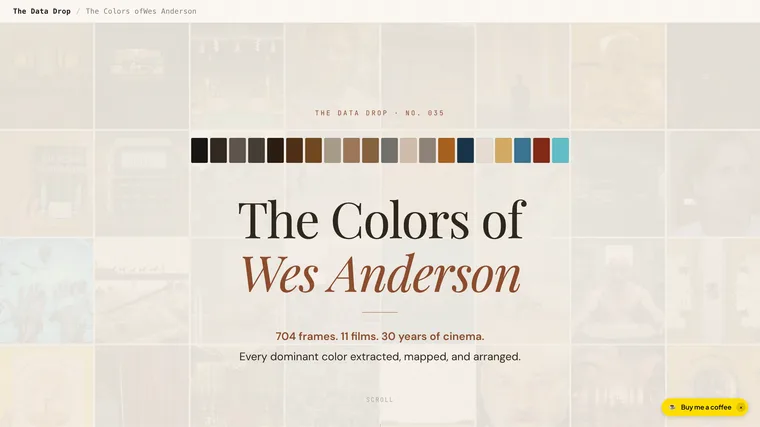
The Colors of Wes Anderson
.
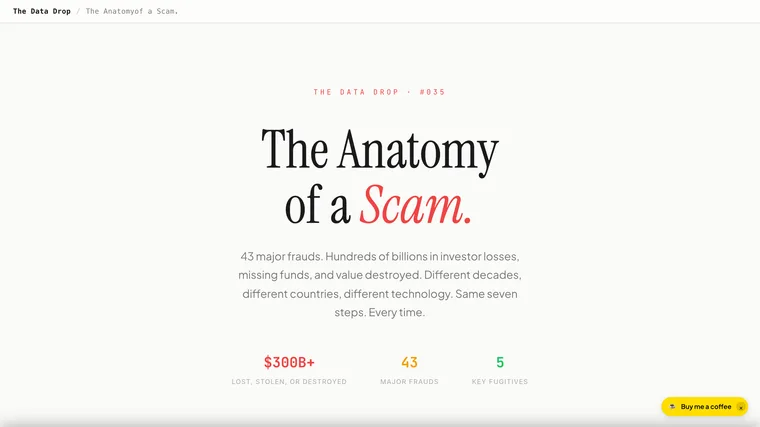
The Anatomy of a Scam
43 major frauds.
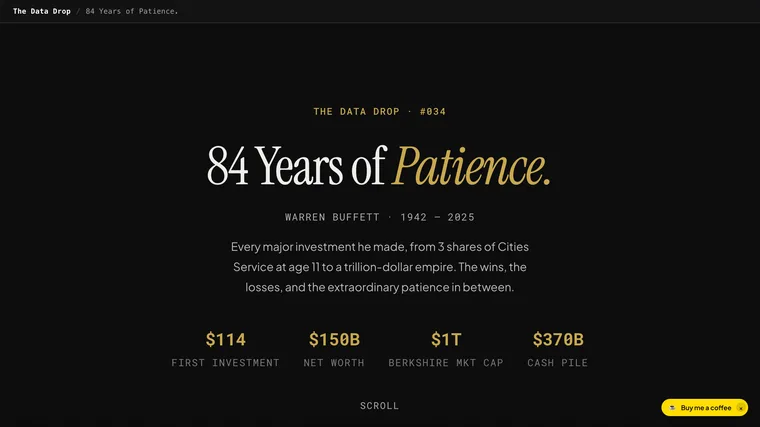
84 Years of Patience
Every major investment Warren Buffett made.
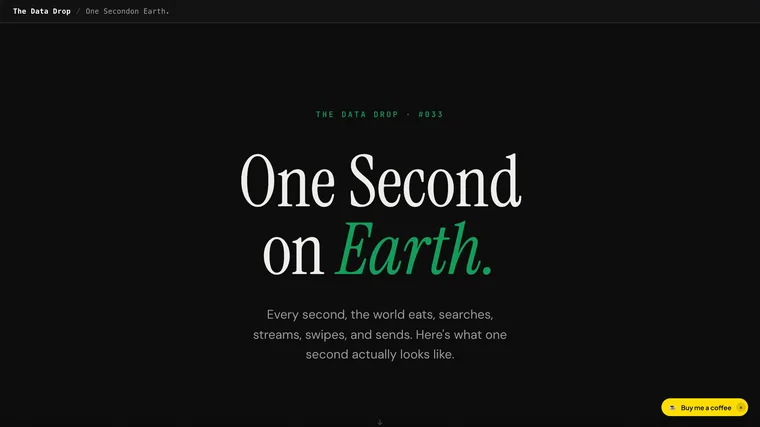
One Second on Earth
1,157,407 WhatsApp messages.
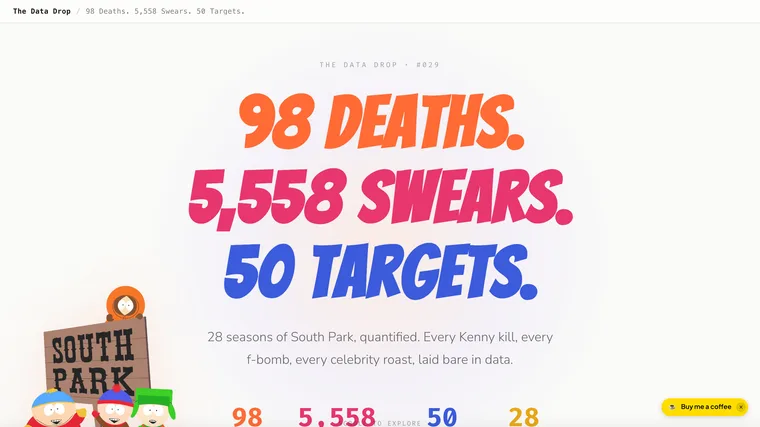
South Park by the Numbers
98 Kenny deaths.
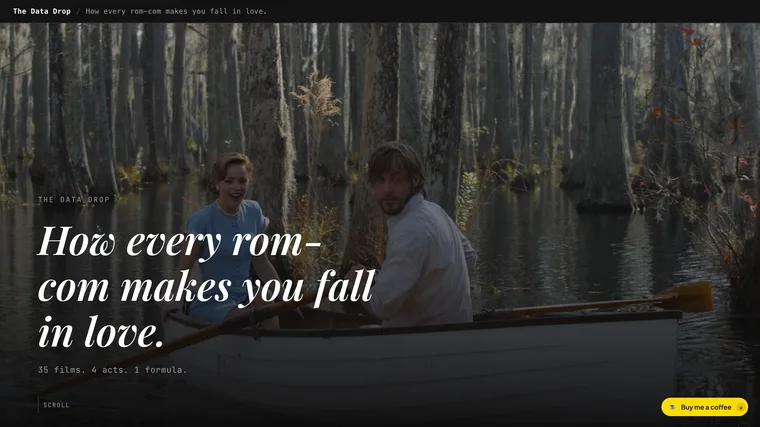
The Rom-Com Formula
35 films.
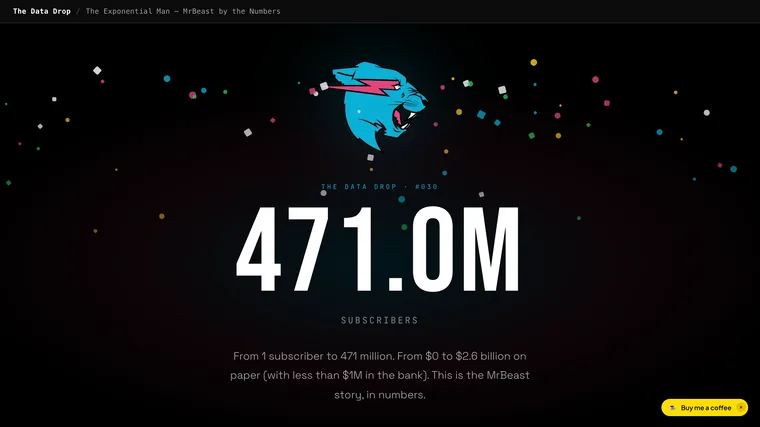
The Exponential Man
From 1 subscriber to 471 million.
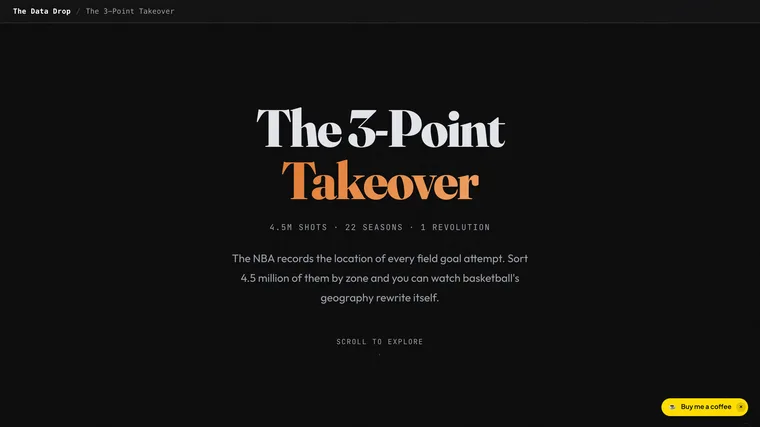
The 3-Point Takeover
4.5 million NBA shots mapped across 22 seasons.
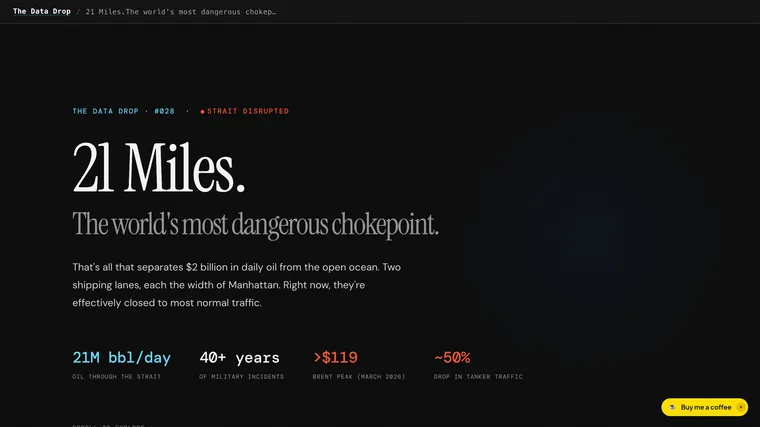
The Strait of Hormuz
~20% of the world's oil flows through a 21-mile gap.
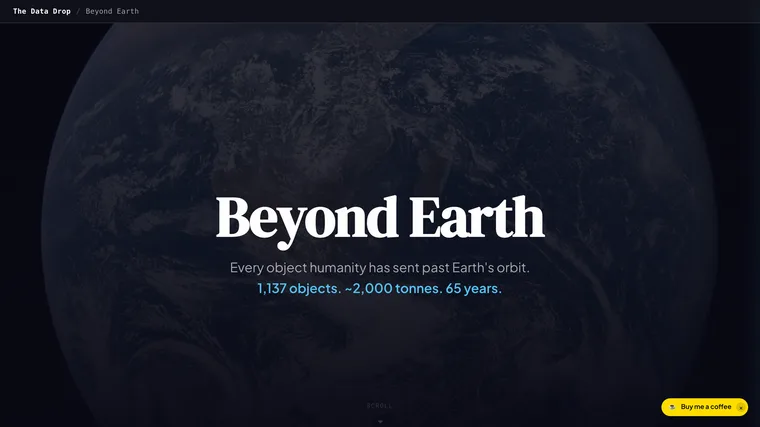
Beyond Earth
Every object humanity has sent past Earth's orbit.
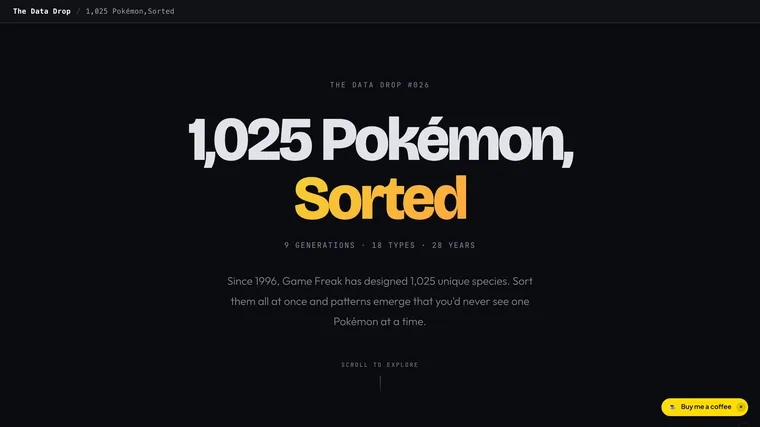
1,025 Pokemon, Sorted
Every Pokemon ever created, sorted by type, power, size, and generation.
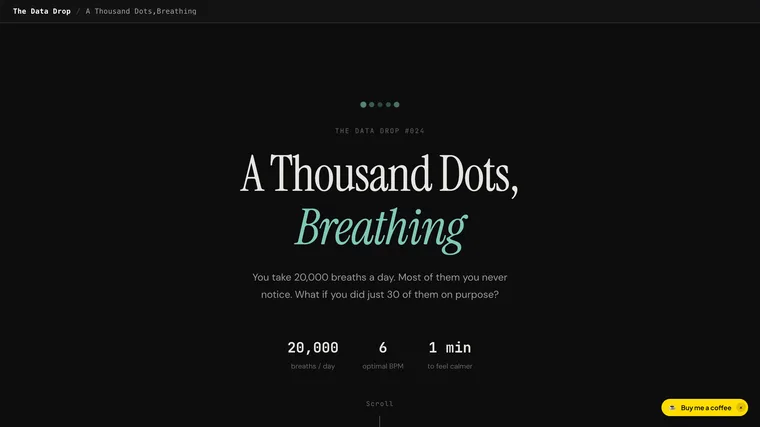
A Thousand Dots, Breathing
You take 20,000 breaths a day.
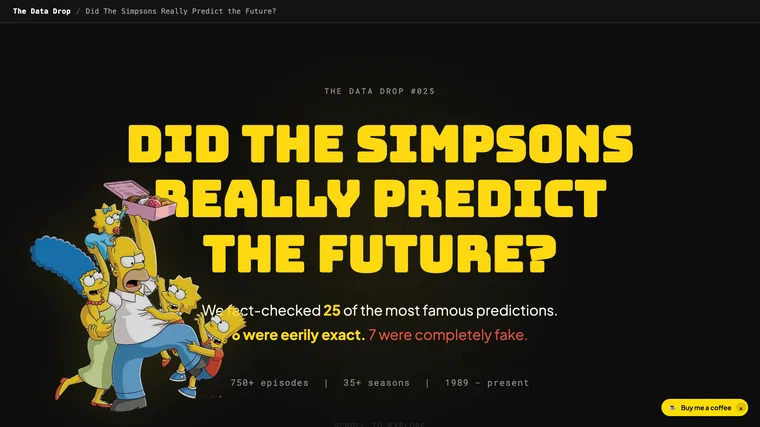
Did The Simpsons Really Predict the Future?
We fact-checked 25 of the most famous predictions.
Oscars 2026: The Night in Gold
Every winner, every speech, every record from the 98th Academy Awards.
What Is Your Country Reading?
What 96 countries read, how much they read, and the one book that defines each nation.
Game of Thrones: By the Numbers
73 episodes.

A Day With Mochi
I tracked every single thing my cat did for 1,440 minutes.
The Elo Lie
2882.
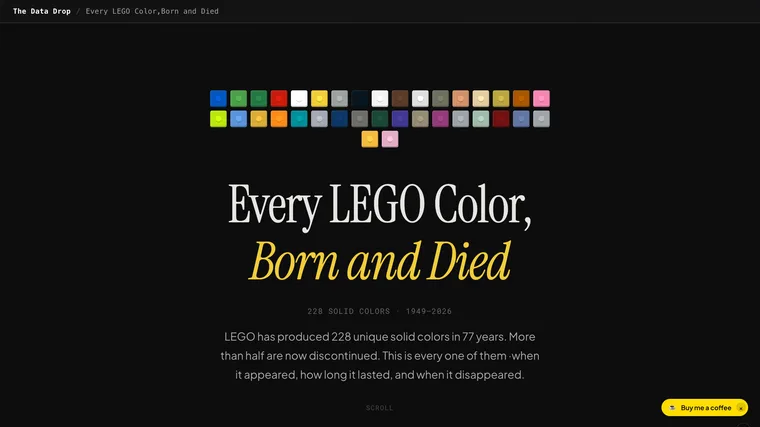
Every LEGO Color, Born and Died
228 solid colors across 77 years.
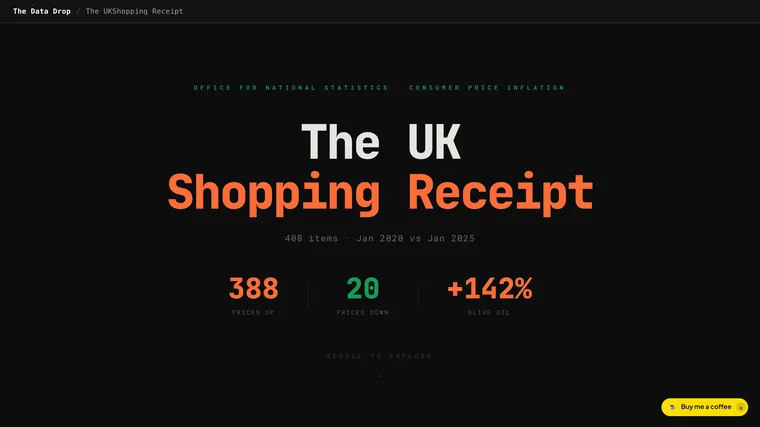
The UK Shopping Receipt
408 everyday items.
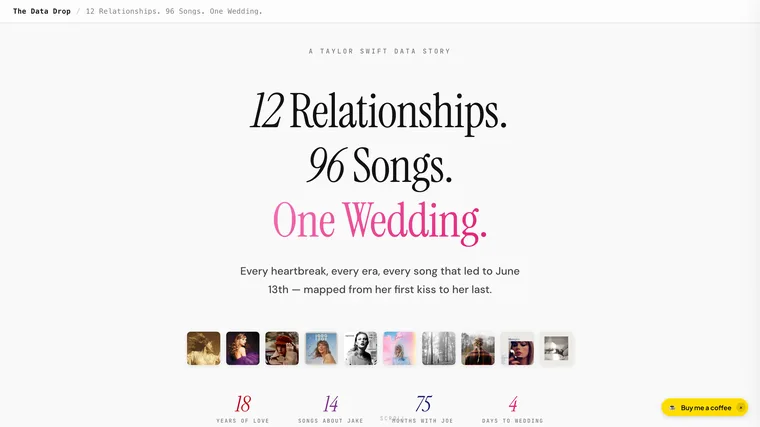
12 Relationships. 96 Songs. One Wedding
Every heartbreak, every era, every song — mapped from her first kiss to June 13th.
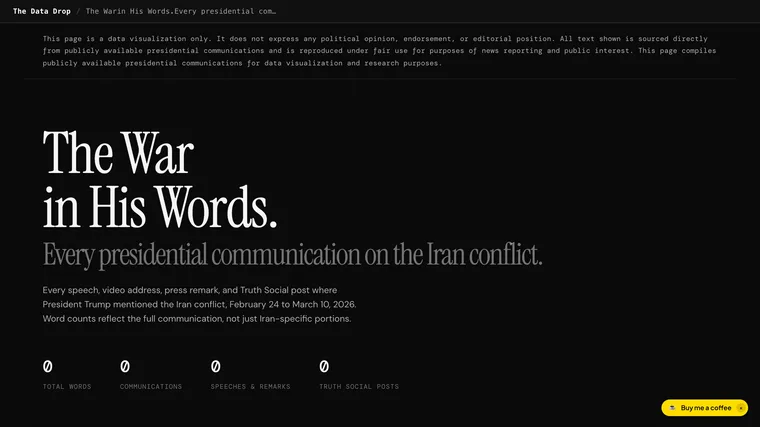
The War in His Words
Every Trump communication on the Iran conflict.
How Long Until Disney Breaks Your Heart?
33 Disney films.
Every Epstein Flight, Visualized
1,708 flights on Jeffrey Epstein's private aircraft.
Why Your $100 Burger Costs $100
45 days of aging.
Who Runs the Fortune 500?
500 CEO names on a wall.
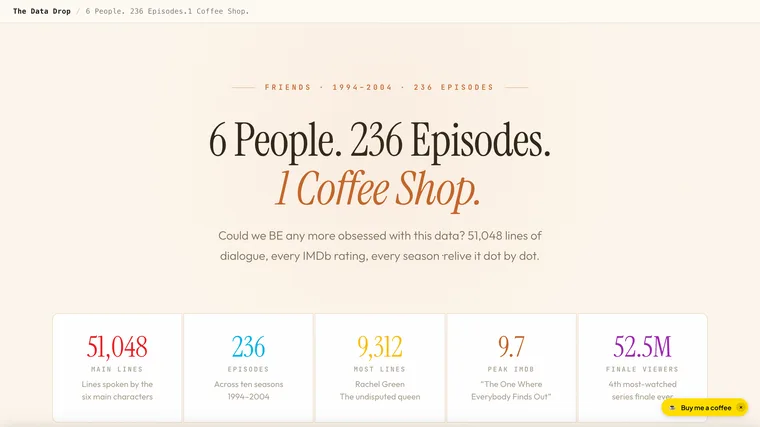
6 People. 1 Coffee Shop
51,036 lines of dialogue across 236 episodes.
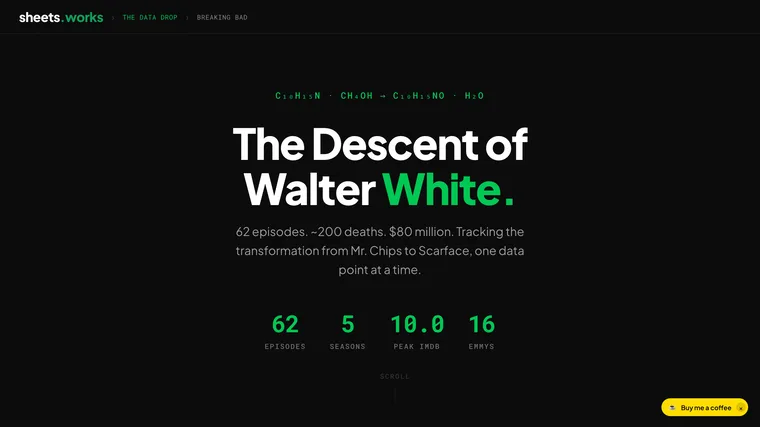
The Descent of Walter White
62 episodes.
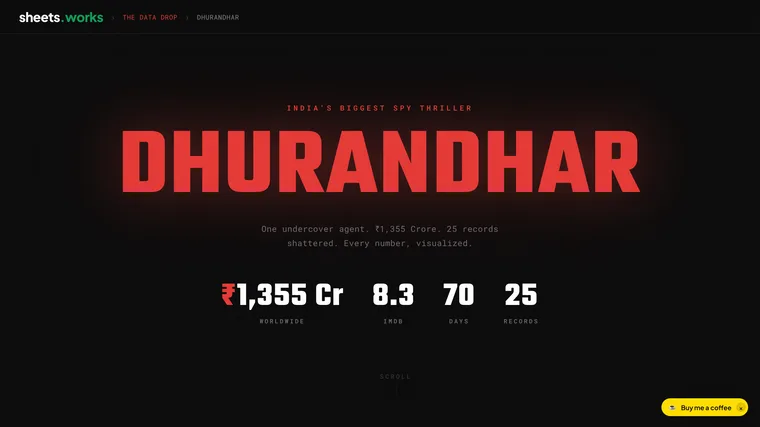
Operation Dhurandhar
The real events behind India's greatest spy thriller.
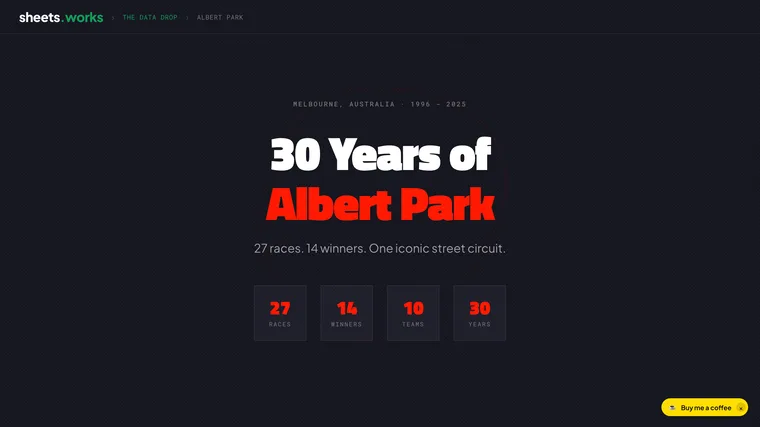
30 Years of Albert Park
Every Australian Grand Prix at Melbourne's street circuit.
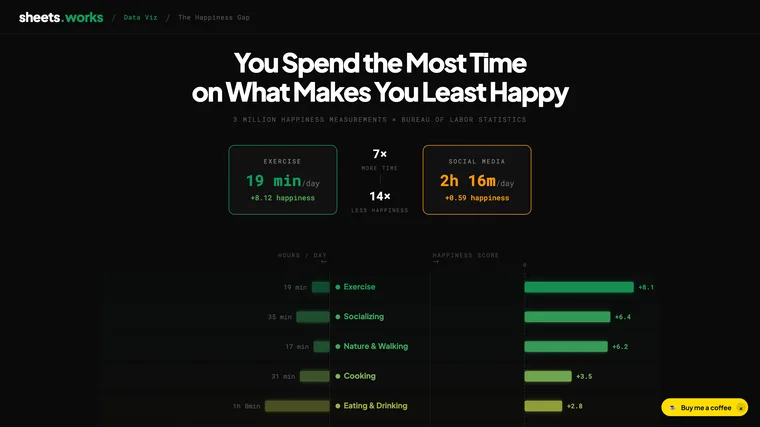
The Happiness Gap
You spend the most time on what makes you least happy.
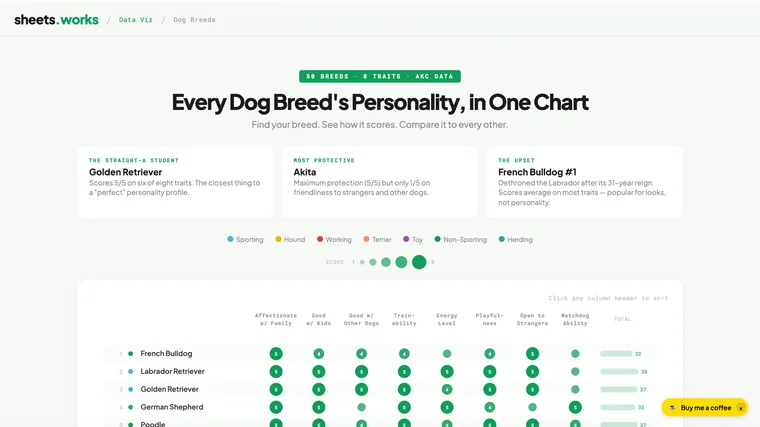
Every Dog Breed's Personality
50 breeds, 8 personality traits, scored 1-5.

Chapter Three
29 matches.
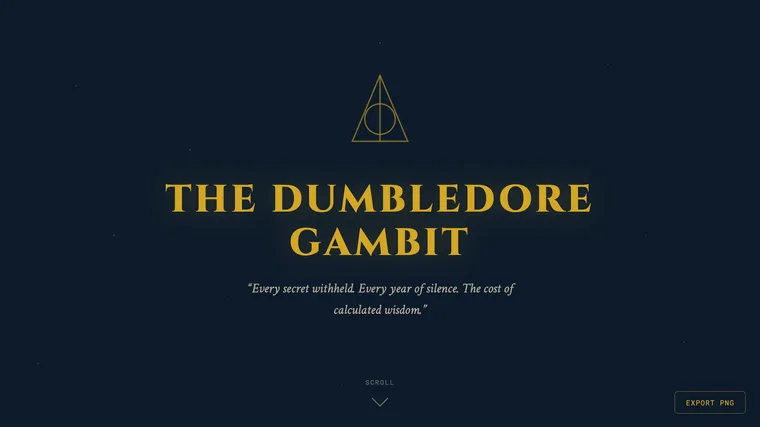
The Dumbledore Gambit
Every secret Dumbledore withheld from Harry, mapped against when he actually needed the inform….
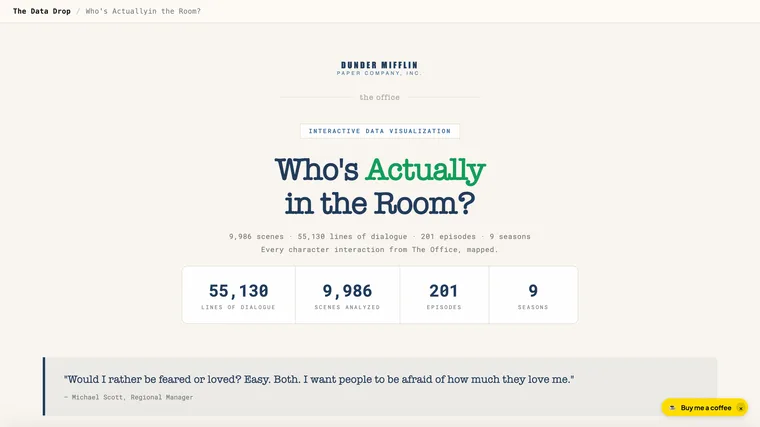
Who's Actually in the Room?
Every character interaction from The Office mapped across 9 seasons.
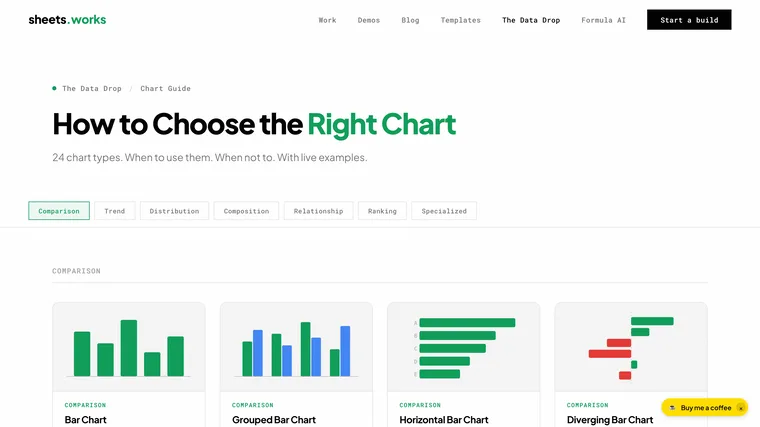
How to Choose the Right Chart
24 chart types with live D3.js examples.
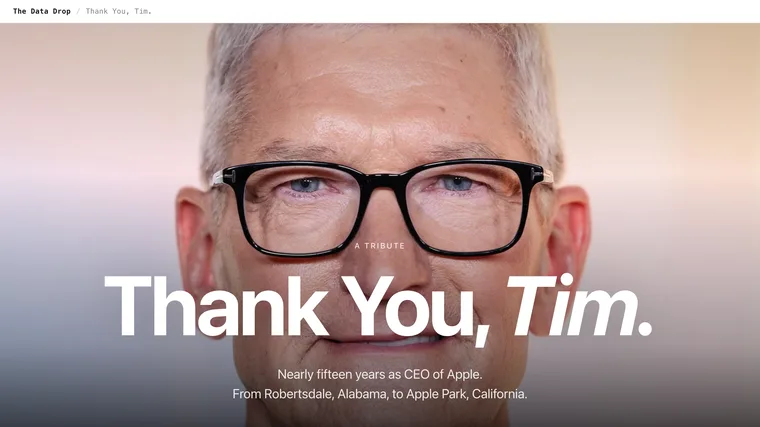
Thank You, Tim
Tim Cook is stepping down as CEO of Apple.
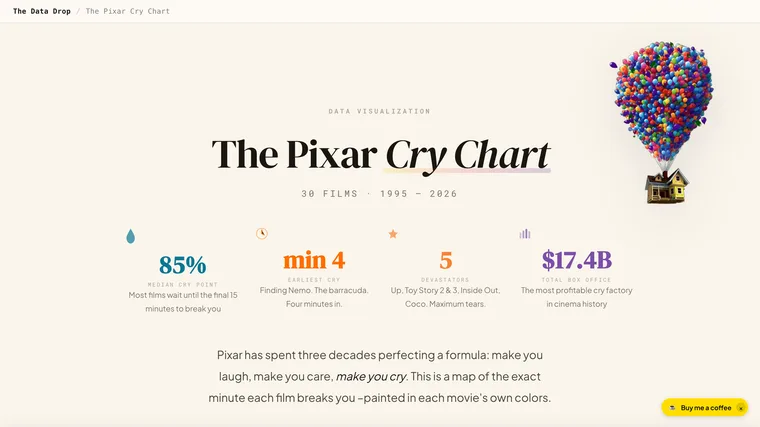
The Pixar Cry Chart
30 films.
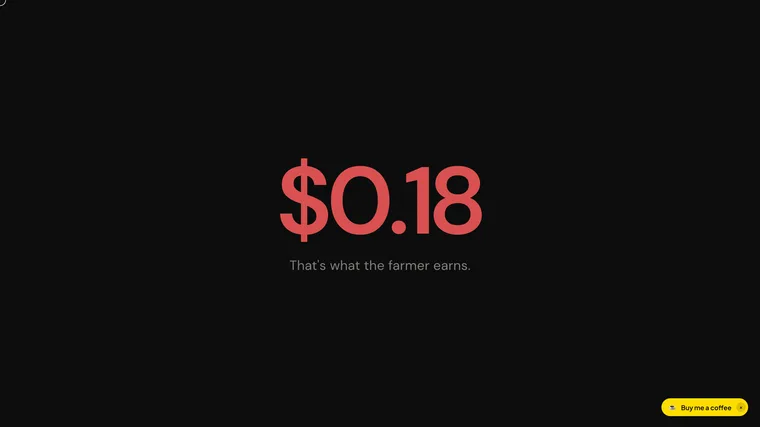
The Bitter Truth About Chocolate
Your $3 bar.
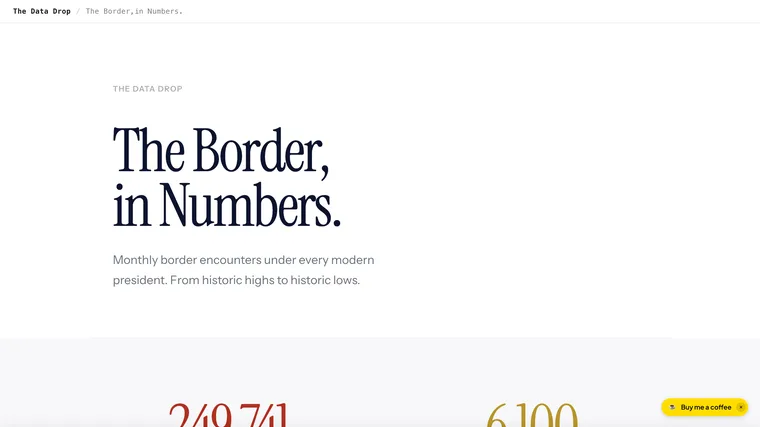
The Border, in Numbers
Illegal border crossings under every modern president.
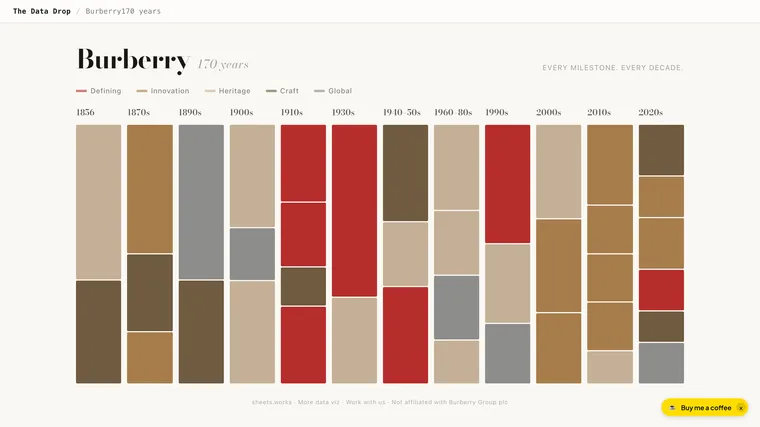
170 Years of Burberry
Every milestone.