Selected work
Six of our own drops. Everything we build for clients gets this bar: real data, custom design, interactions that earn the scroll.
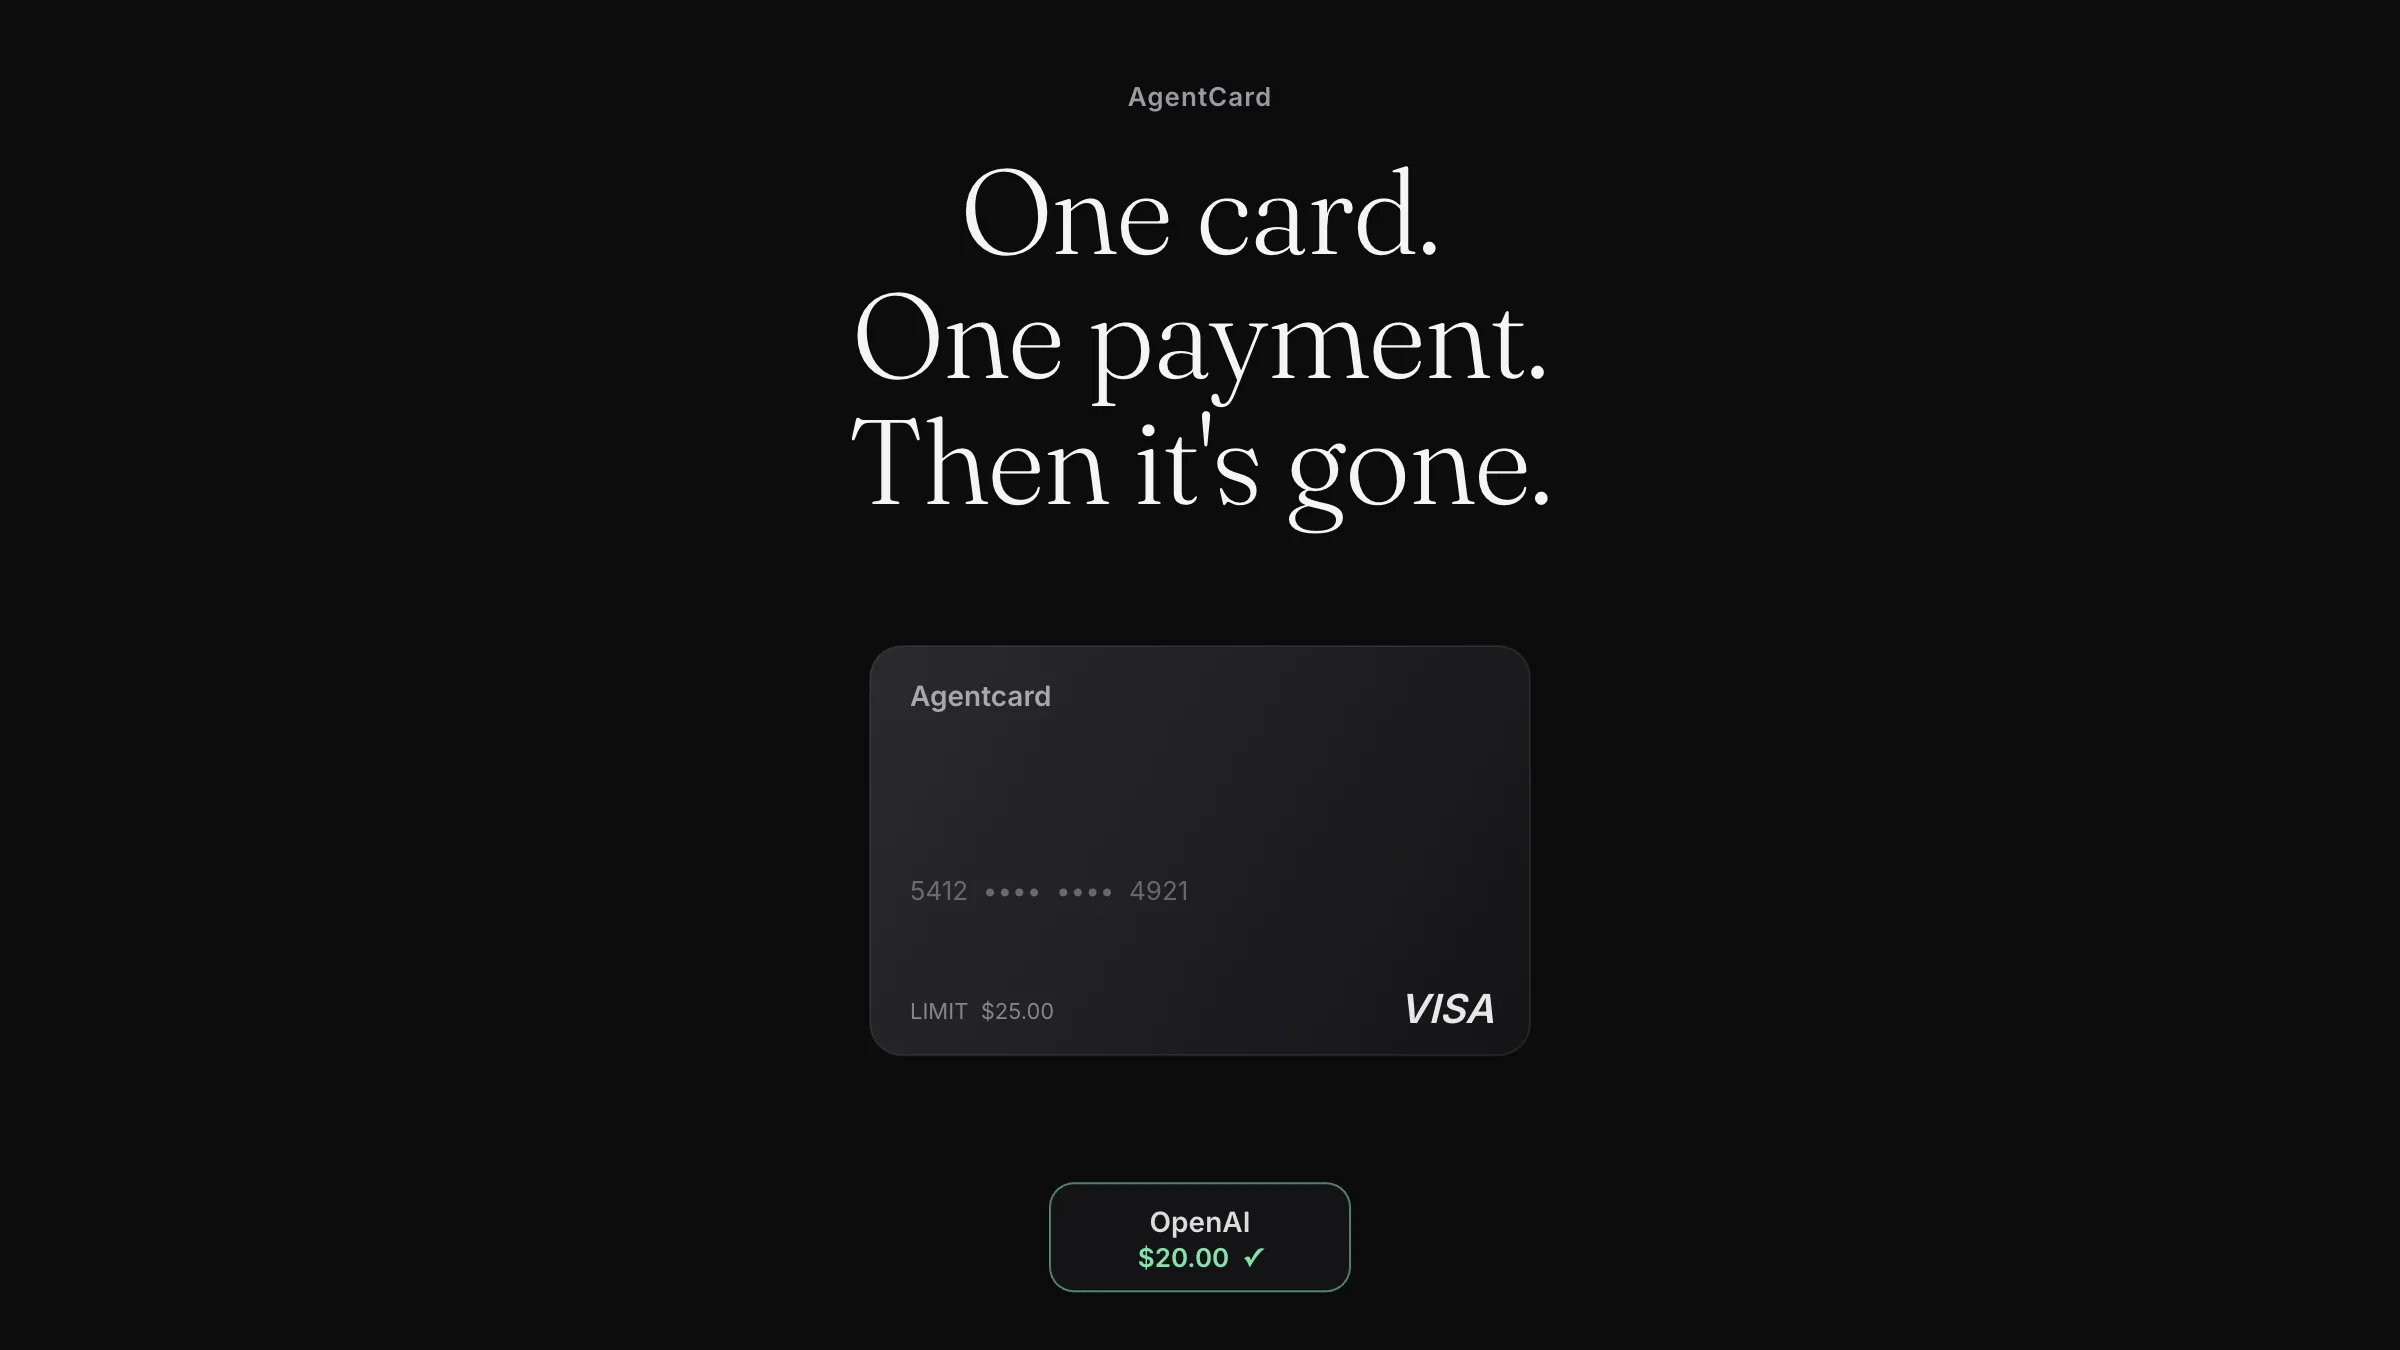
No. 068 · Tech · featured by 512 Pixels
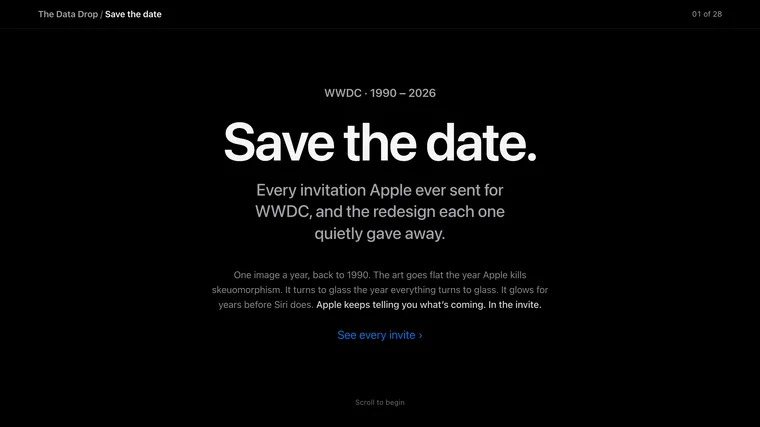
Save the date
Every WWDC invite Apple ever made, 1990 to 2026. The art keeps spoiling the keynote.
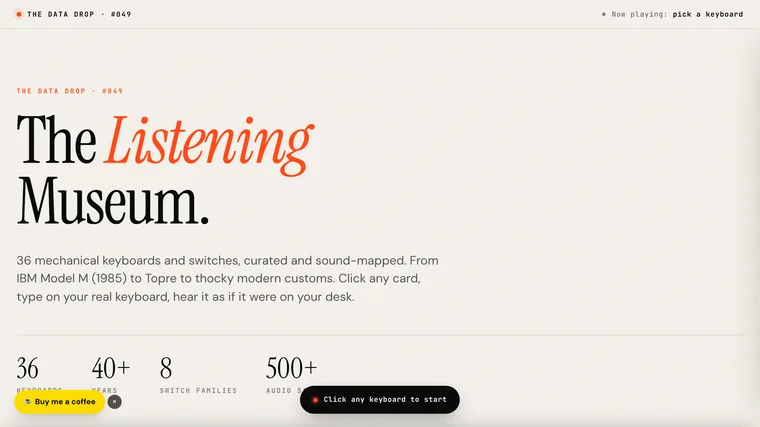
No. 048 · Tech
The Listening Museum
36 mechanical keyboards, sound-mapped. Type on your own keyboard to hear each one.
No. 007 · Screen · 100K+ views
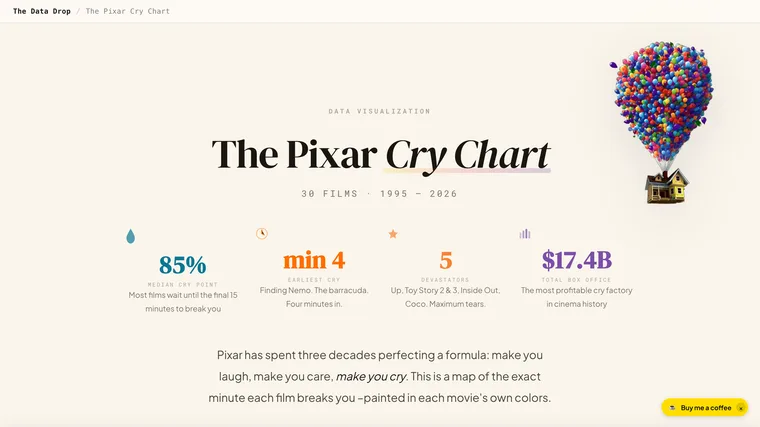
The Pixar Cry Chart
30 films mapped to the exact minute they break you.
No. 040 · Tech
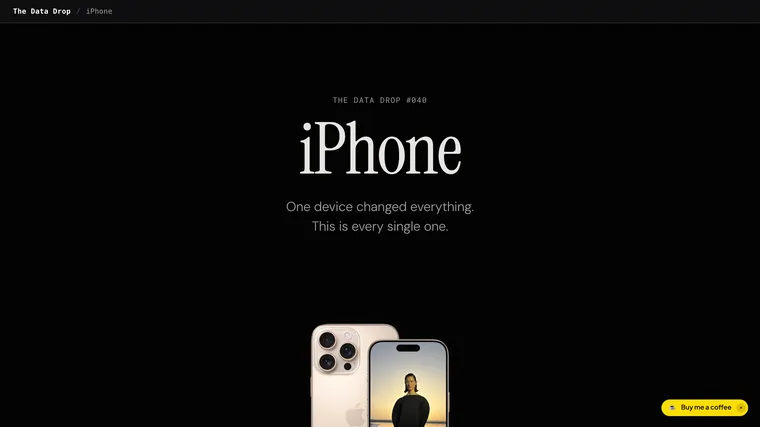
Every iPhone Ever Made
19 years, 52 models, 2.3 billion sold. The complete visual history.
No. 018 · Life
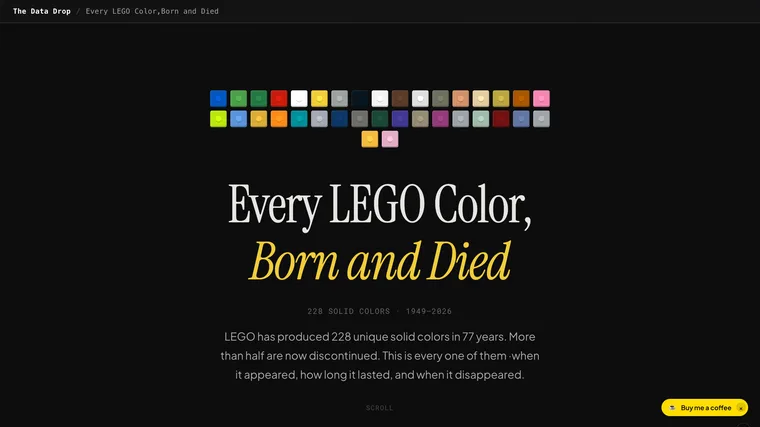
Every LEGO Color, Born and Died
228 solid colors across 77 years, told as a scrollytelling journey.
No. 049 · Sport
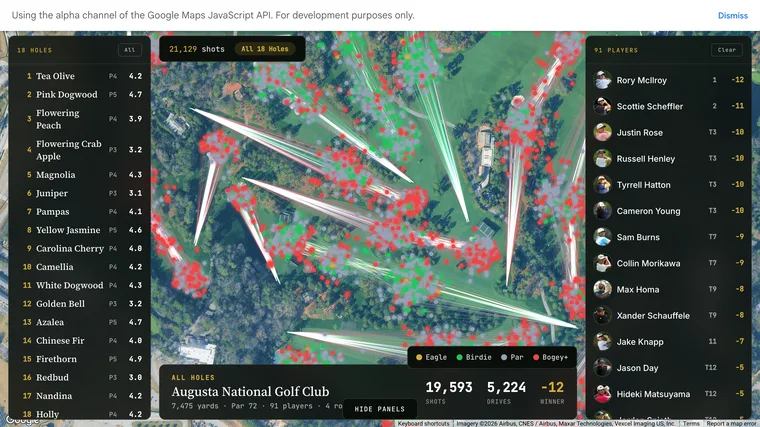
Every Shot at The Masters
19,593 shots from 91 players, mapped onto Augusta National.