Every railway line India has built since 1853, mapped from the original opening records. It starts with one train out of Bombay.
scrollpinch to zoom · drag to pan · tap a station · esc or × to close
Then two lines were drawn that carried no trains.
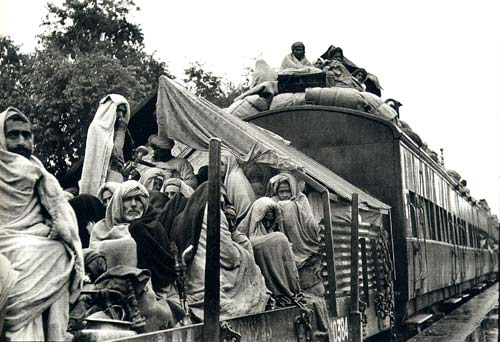
Every other plate in this history adds track. One moment subtracts. Not by lifting a single rail, but by moving two borders across the map. The left map took 94 years to build. The right map is the same track, the morning after.
A refugee train, Punjab, 1947 · Public domain
2014 — Today · a decade of record investment
The map was finished by 1931. The last decade rebuilt what runs on it.
New geography is not where the modern story lives. Since 2014 the network has been electrified almost end to end, rebuilt station by station, and pushed to run faster than it ever has. Every figure below is public record.
97%
of the broad-gauge network now runs under electric wire
About 21,800 km was electrified in the sixty years to 2014. As much again has been added since.
Ministry of Railways
9×
the capital put into the railway in a single year
₹28,174 crore in 2013–14. A record ₹2.62 lakh crore allocated for 2024–25.
Union Budget · PRS Legislative Research
8.5 km
of new line, doubling and gauge conversion built every day
The pace in the five years to 2014 was 4.1 km a day. It has since more than doubled.
Ministry of Railways
136
Vande Bharat services now running
The first left New Delhi for Varanasi on 15 February 2019. Before that date there were none.
Ministry of Railways
0
unmanned level crossings left on the broad gauge
Every one was closed or staffed by 31 January 2019, ending a century-old cause of death on the tracks.
Press Information Bureau
1,300+
stations being rebuilt at once
The Amrit Bharat programme, begun in 2023, is the largest station upgrade the railways has ever attempted.
Ministry of Railways
The lines were drawn a century ago. The work since has been quieter and harder to map: more trains, on faster track, under continuous wire, reaching stations the records had left in grey.
Keep reading
The rest of the map is one email away.
You've seen how the lines were drawn. Past this point: the full eighteen-decade atlas, the search that dates your own home station, and how it was all put together. Leave your email and it opens right here, for good. One interactive data story every Tuesday, nothing else.
Already subscribed? Enter the same email, nothing double-sends.
Eighteen decades, one frame.
The same map, drawn eighteen times at identical scale: black for the lines added in that decade, faded ink for everything before. Read it like a contact sheet: the few lines of the 1850s, the rush of the 1890s–1900s, the long pause after 1931, the late push that finally reached Kashmir. Hover any decade for its biggest opening; click it to open it full screen.
When did the rails reach you?
Type your home station. 7,927 of the 11,665 stations on this map carry a date. Yours probably knows exactly when it joined the network.
Methodology, honestly.
The spine of this piece is a section-by-section ledger of 1,527 railway line openings, 1853–1931, compiled by Fenske, Kala and Wei from colonial administrative records: each entry a section ("Chittagong to Feni"), an exact opening date, an operating company, a mileage.
We placed each section's endpoints against a gazetteer of 13,000+ stations across India, Pakistan, Bangladesh and Myanmar (Wikidata, DataMeet), translating colonial spellings along the way: Cawnpore to Kanpur, Tannah to Thane. Each dated section was then routed along today's actual rail alignments (OpenStreetMap) and validated against the ledger's own recorded mileage. Stations inherit the earliest dated line within reach; where Wikidata records an earlier date of its own, the earlier date wins. The modern era (Konkan 1998, the Kashmir line through the Chenab bridge in 2025) comes from Wikidata's dated railway lines and Indian Railways records. Every line running today that we could not yet date is drawn in grey, from OpenStreetMap, so the network you see is the whole network.
Coverage: 850 dated sections in ink · 28,000 km running today in grey, dates pending · 98% of routed mileage follows true alignments · 7,927 / 11,665 stations dated · vanished lines appear as straight, fainter segments
What the grey means: about a third of the historical mileage resists confident dating. Stations renamed beyond recognition, river-ghat termini that no longer exist, lines whose records vanished with the companies that built them. Rather than leave those lines off the map, we draw everything running today in grey and promote a line to ink only when we can prove its date. The network is complete; the dates are earned.
The Data Drop
Made by one person. One interactive data story, every Tuesday. Last time it was every iPhone ever made; before that, the sound of 130 keyboards.