I studied and worked in London for two years. I lived at Goodenough College and took the Russell Square tube every morning.
St Paul's and Tate Modern face each other across the river. The grass on the north bank between them was my best date spot. It worked every single time.
I miss it, and I have been trying to make something about London for some time now.
Then I saw isometric.nyc, which cannoneyed made for New York, and I was like yes, this is it, we need to do this.
New York is a grid. London bends, the river cuts through it twice, and the good bits are often small and low down. Whether the same idea would survive that was the question.
It covers Zones 1 to 4. Hendon at the top, Ravensbourne at the bottom. 216 square kilometres. It stops at Zone 4 because Zone 5 wants money I do not have. Every square costs more than you think, and London is annoyingly large.
So if you want Zone 5, you can buy me a coffee. Or join the membership, and get the Biopsies while you are at it.
Scrolling across it feels like being back there. You do not read a city quickly, the same way you do not read a painting quickly. You find one thing, then another, and then you have been at it twenty minutes. We wrote about that once: how to read a painting.
A map is only a map. What makes London is what is inside it. So we found another reason to keep going at it. The buildings. 183 of them. What they are. Who is buried in them. What is kept there. Who went to school there.
Mostly I wanted to show London off. All of it. The place I studied. The place I lived. The station I stood on every morning. The date spot. The lot.
Everything below is how it was made. Every step was something that went wrong before it went right.
Take a picture of London from a computer.
We needed a 3D model of London that a program could look at. Apple has a beautiful one. You cannot get inside it: it only exists in Apple's own app, and there is no way to point your own camera at it.
Google publishes theirs. Real buildings, real shapes, built out of aerial photography, and you can fly a camera around inside it from your own code. That is the whole reason this is Google and not Apple.
So we point a camera at it and take a picture. Then we move the camera a bit and take another. Then again. Like photographing a football pitch one penalty box at a time.
The camera is turned and tilted once, at the start, and then never touched again. It only slides. If it turned even slightly, the pictures would not fit together.
Why the camera sits where it does
Looking straight down gives you a satellite photo. Roofs and nothing else. Looking from the side gives you a postcard, where the front row of buildings hides everything behind it.
Tip it to 45 degrees and you get both: the roof and one wall of every building, and nothing hides behind anything. That is the angle every game like this has used for thirty years, and cannoneyed used it for New York.
The 15 degree turn is a smaller thing. London's streets mostly run north to south and east to west. Point the camera square at them and every wall lines up dead flat, which looks like a spreadsheet. Turn it a little and the streets run diagonally across the picture. It is the same reason you photograph a building from the corner and not head on.
Then we argued about height for two days
Height was the hard one. We rendered the same piece of London at seven different heights and put them side by side.
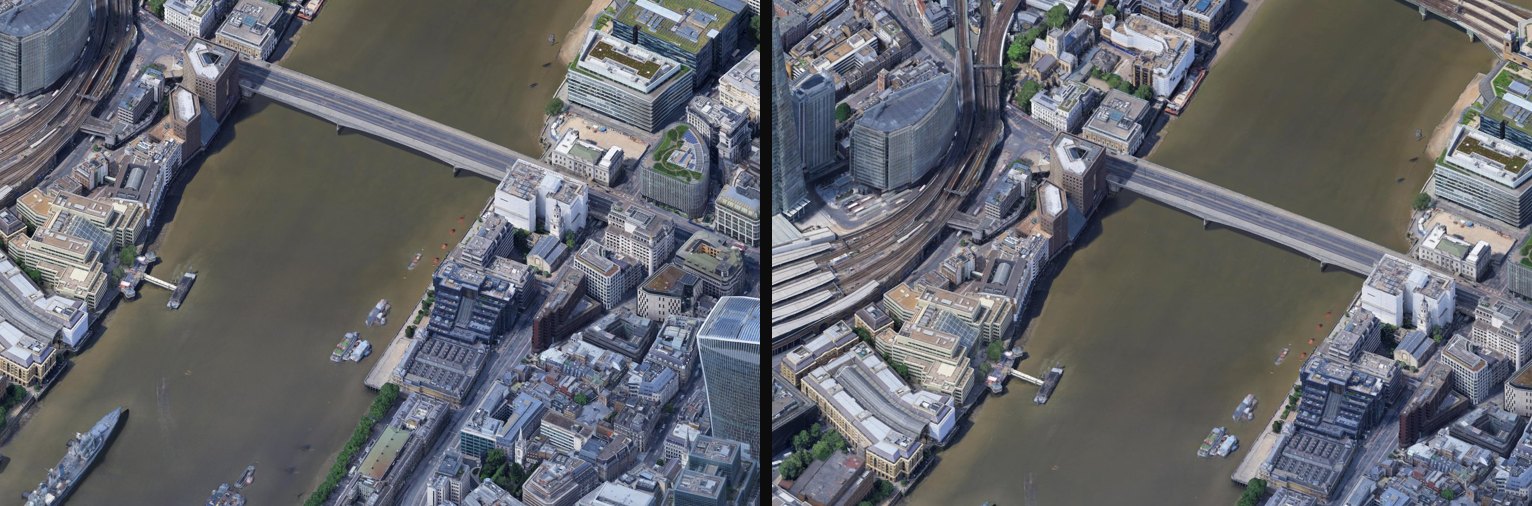
Fly low and one picture is just a street, and you need thousands of them. Fly high and every roof turns to soup. 350 metres is the middle. At that height you can see a bus, but you cannot read its number plate.
Four renders a square, 441 squares, so around 1,700 pictures for the city you are looking at. That is before the ones we threw away testing heights.
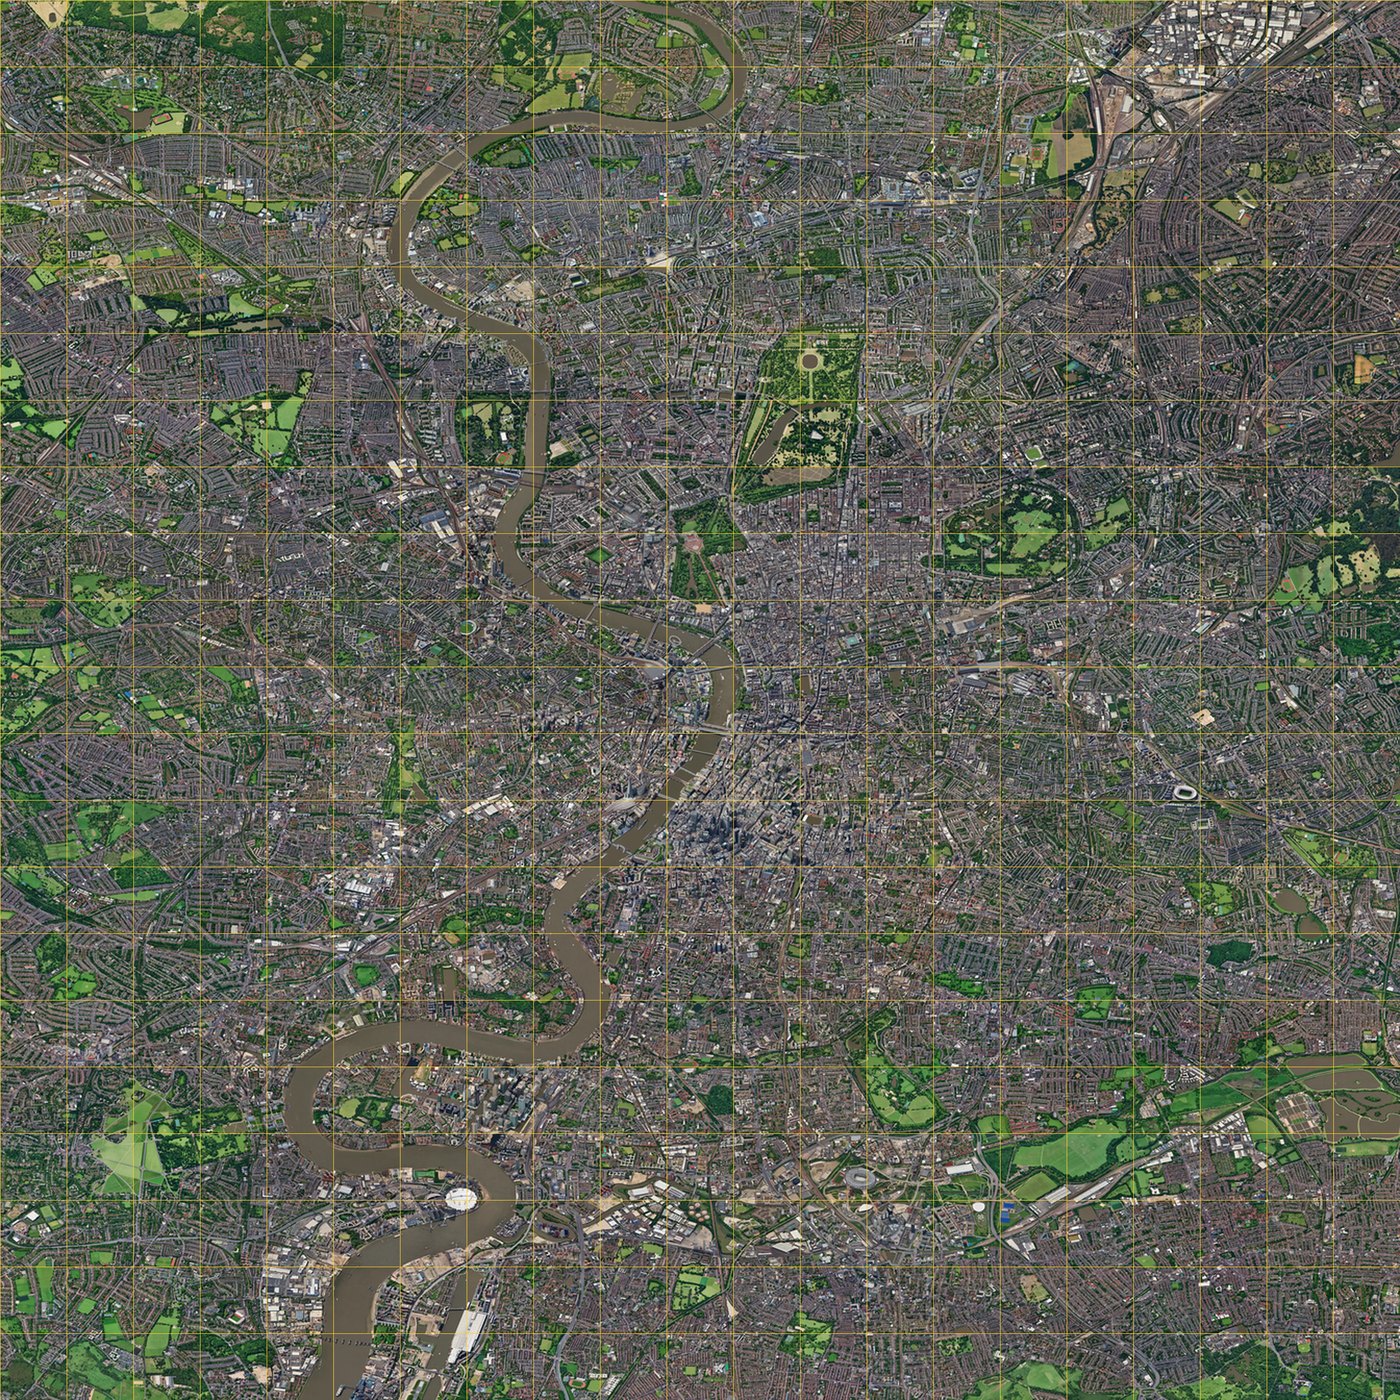
Glue four pictures into one square.
A square has to be square. If the piece you send is wider than it is tall, the drawing comes back stretched, and a stretched square will not sit next to its neighbour. So four pictures, two by two, and you get a square 2048 pixels wide. On the ground that is 700 metres across, about an eight minute walk.
We tried the opposite first
Our first plan was the other way round: lots of small pieces, and train our own model to draw them, so the style would be identical every time by definition.
Three models later and £40 down, it was not happening. Training needs a big pile of examples in the style you want, and we did not have one, because the style did not exist yet. You cannot train a model on pictures you have not drawn.
Then we tried bigger
Fewer squares means fewer joins, and joins are where everything goes wrong. So we sent a 3 by 2 block instead.
It came back smaller than we sent it. The AI has a ceiling on how big a picture it will hand you, and past that it quietly shrinks yours to fit. We had paid for detail and got a resized copy.
So we found the ceiling and sat just under it. 2 by 2 fits. 3 by 2 does not. That is the only reason a square is 700 metres and not a kilometre.
Ask an AI to draw it again.
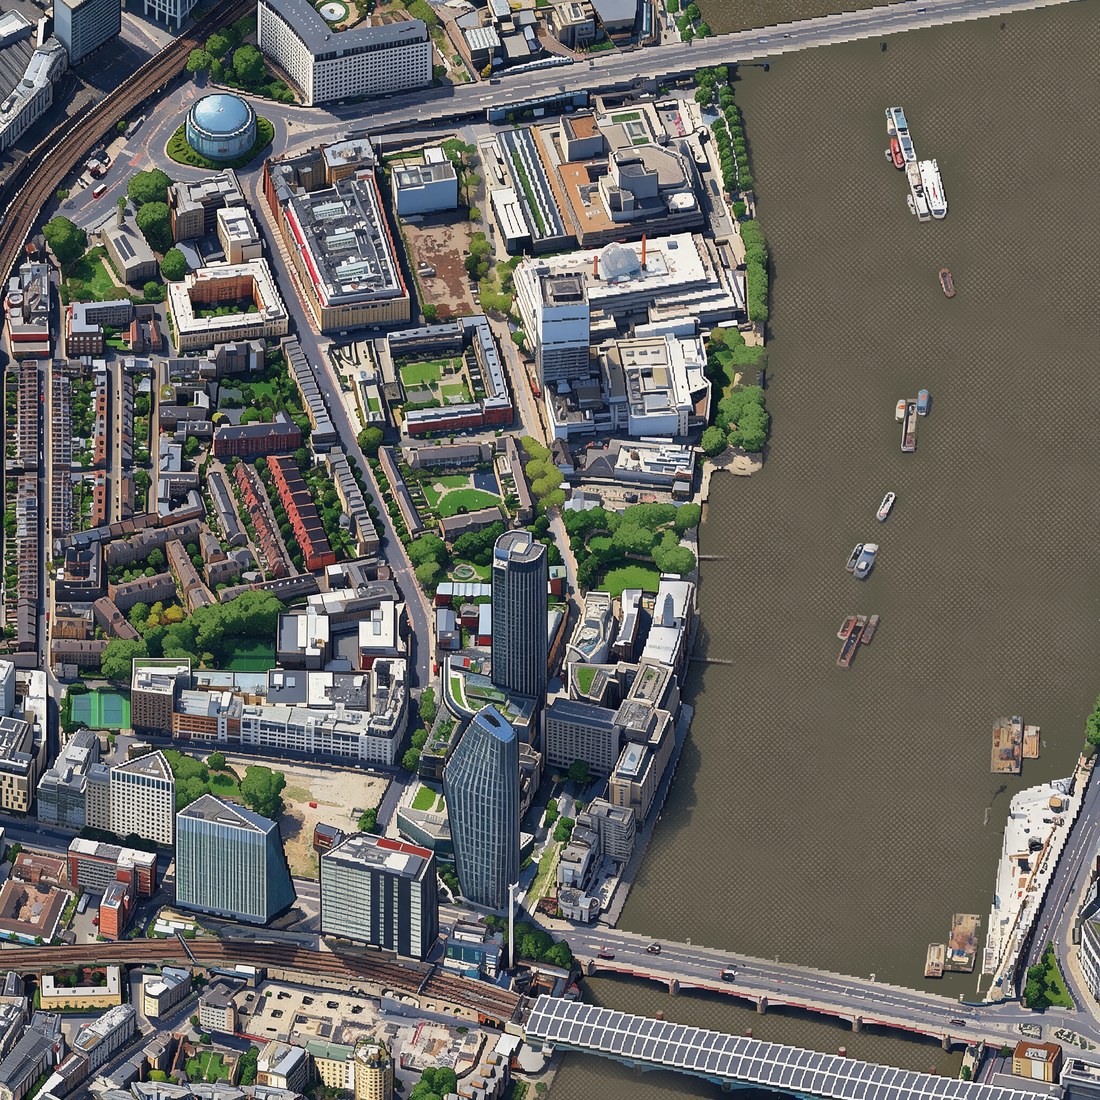
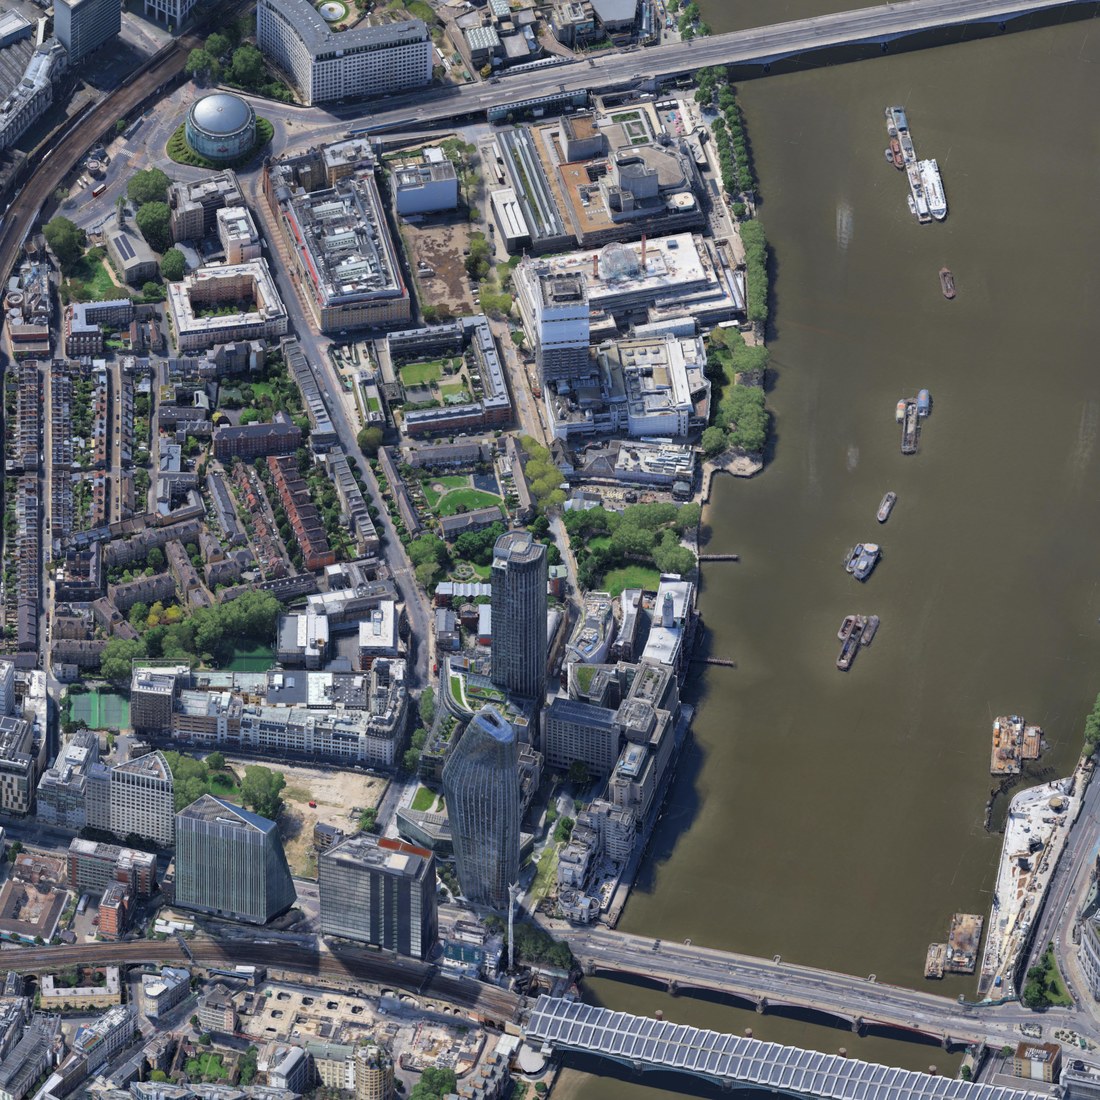
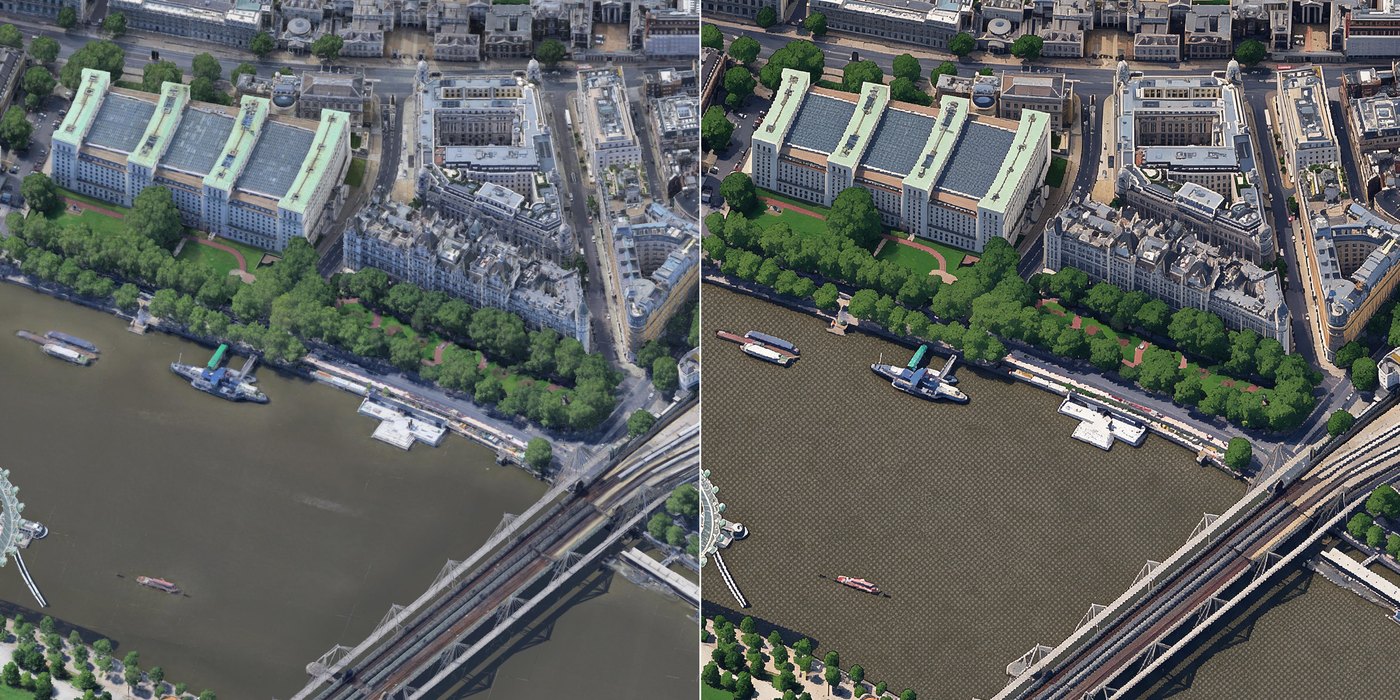
Now we send that square to an AI that makes pictures. We tell it: draw this again, as a drawing, and do not move anything.
We also send it a second picture. That second picture is a square we already like the look of. It is there to say: make it look like this.
One square costs about four pence. Drawing all 441 of them once comes to roughly £17, which is less than a takeaway. That is only the last run, though. Counting everything that was drawn, thrown away and drawn again, it is over £160.
Drag the line to see one square before and after.
 drawnphoto
Cut it into small pieces.
The finished city is 43,008 pixels wide. As one file that is four gigabytes. Our first attempt asked your browser for all of it at once. It went exactly as badly as you would think.
So we cut it up. Nine sets of tiles, each set half the size of the one below, like a set of Russian dolls. When you are far away you get the small blurry ones. When you zoom in you get the big sharp ones. You only ever download the bit you are looking at.
If a tile has not turned up yet, we borrow the matching patch from a bigger, blurrier one and stretch it over the gap. It goes sharp a moment later. That is why the map never flashes empty while you drag.
Some of it is still wrong. Tell me which bit.
There are squares in here that are not right. A join that steps, a roof that went strange, water where there should be a field. I know about some of them. I do not know about all of them.
If you have read this far you probably like it, so help me finish it.
On the map, press Q. Every square gets its number written on it. Point at the one that looks wrong, note the number, and send it to me. Just the number, like m11_3, and I will go and fix it.
Press Q again to put it away.
The other half is behind a door.
Everything above is how the map looks and how it loads. It leaves out the five weeks' worth of problems that actually took the time.
Biopsy is the members-only series where a finished Data Drop goes on the table and gets cut open. Number four is this one, and it is the biggest so far.
- How we got the squares to match. Every style we tried, every AI we compared, and the £40 we spent trying to train our own before giving up.
- How we scored a join. Including the first attempt, which failed because Hyde Park scored well by being boring.
- The water. Why one locked colour was not enough and where the two days in Photoshop went.
- How the map learned where it is. The hand-clicked points that drifted, and the river that fixed it.
- 61 squares, before and after. Every one that had to be drawn twice, side by side, with what was wrong.
- 441 squares and 840 joins, measured and mapped, so you can see where the bad ones are.
- All three prompts, unedited. 664 words of them.
- Every drawing at full size, and all 65 programs.
- Google Photorealistic 3D Tiles, the ground under every square.
- Wikipedia and Wikidata, the writing and the record tables. CC BY-SA.
- Historic England, every listing, grade and entry number. Open Government Licence.
- Wikimedia Commons, the photos the buildings were drawn from.
- ALVA, visitor numbers, for the places that publish them.
- OpenStreetMap, place names and where they sit. ODbL.