Every David on this page was losing first. We counted 370,713 matches, 286 insurgencies and 24,511 court judgments to find out how often people climb back from the bottom, and what the ones who made it did.
sheets.worksOctober 2026
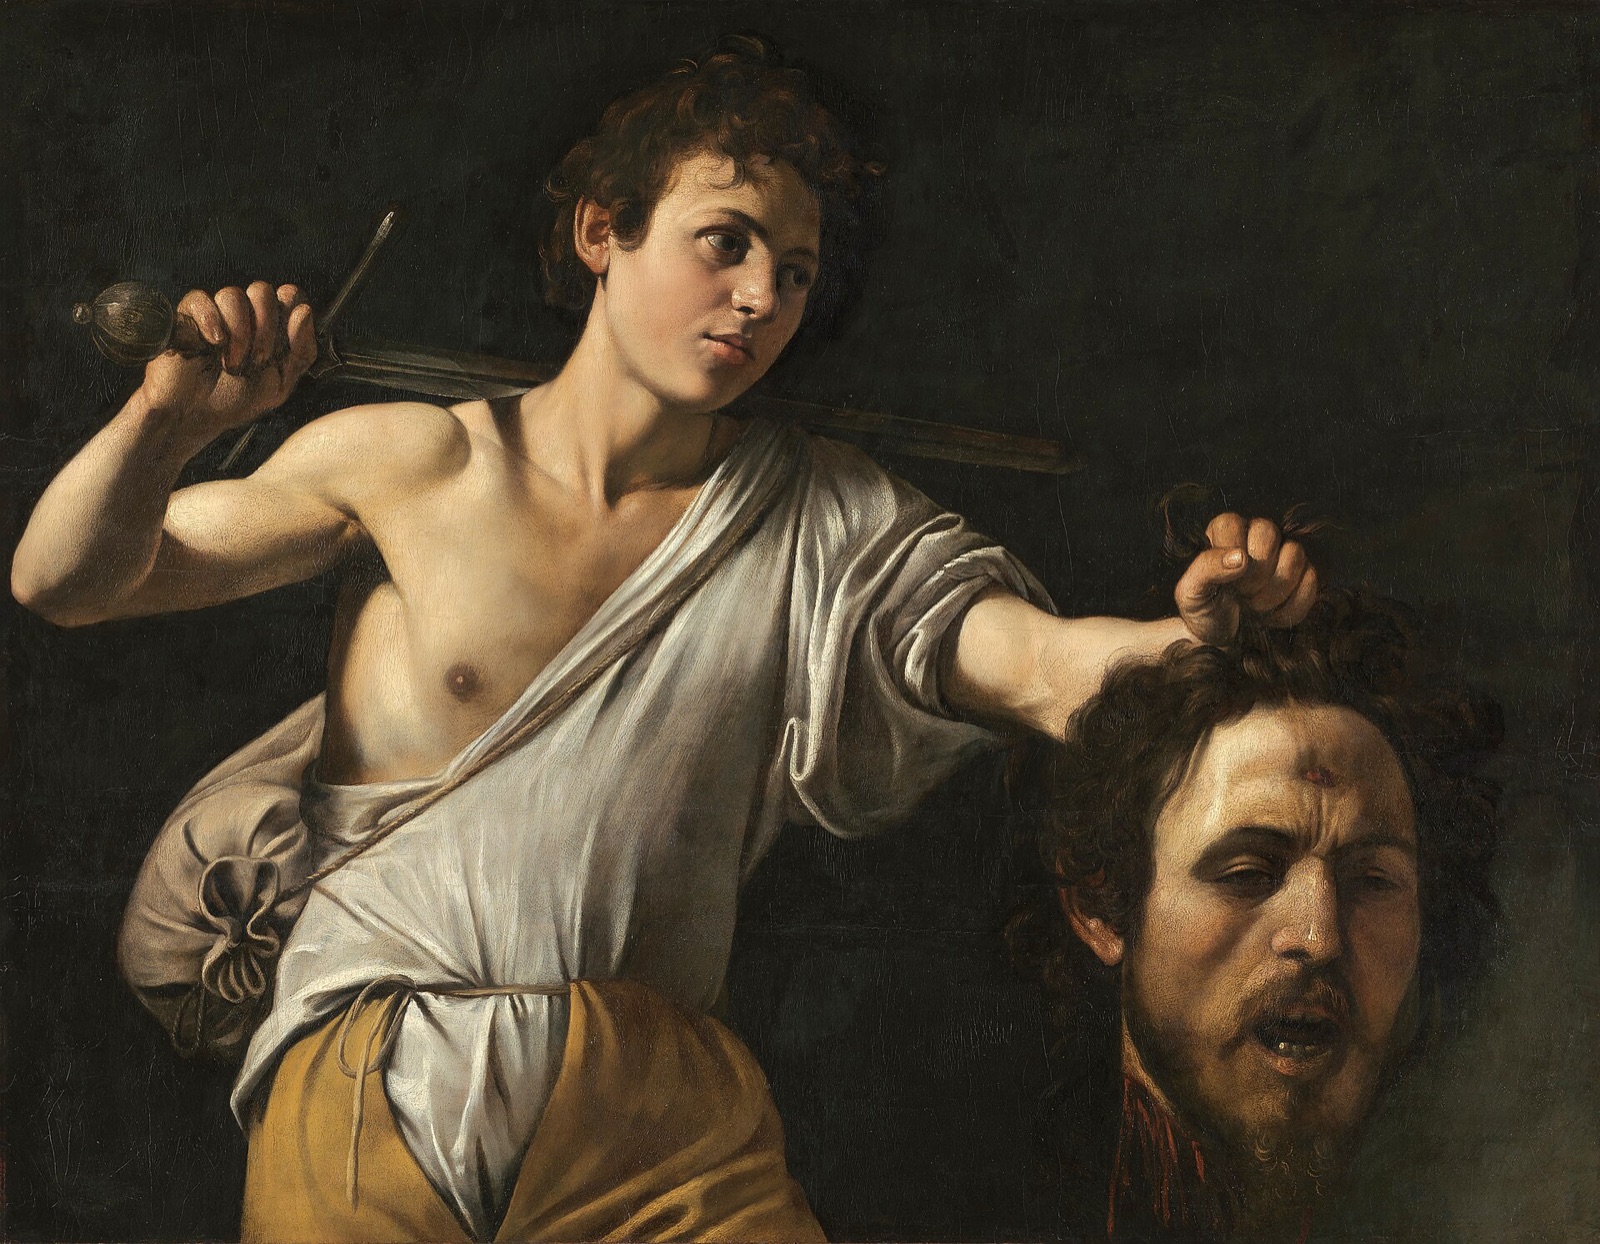
Caravaggio, David with the Head of Goliath, around 1600. Kunsthistorisches Museum, Vienna. Public domain
I cheer for the small side, most of the time, whether it is a team I have never heard of or one person taking on something a thousand times bigger, and when they win it feels a bit like a personal win.
So I wanted to find out how often it actually happens, and whether the numbers could get more people to believe that a Goliath, whatever yours happens to be, can be beaten. There is a line I keep saying to myself these days, and it has really helped me move.
I can do anything, and it will work out.
These are some of the people nobody gave much of a chance, in their own words, from around the time it looked worst, and under each one is a number from the records we counted for people in the same spot.
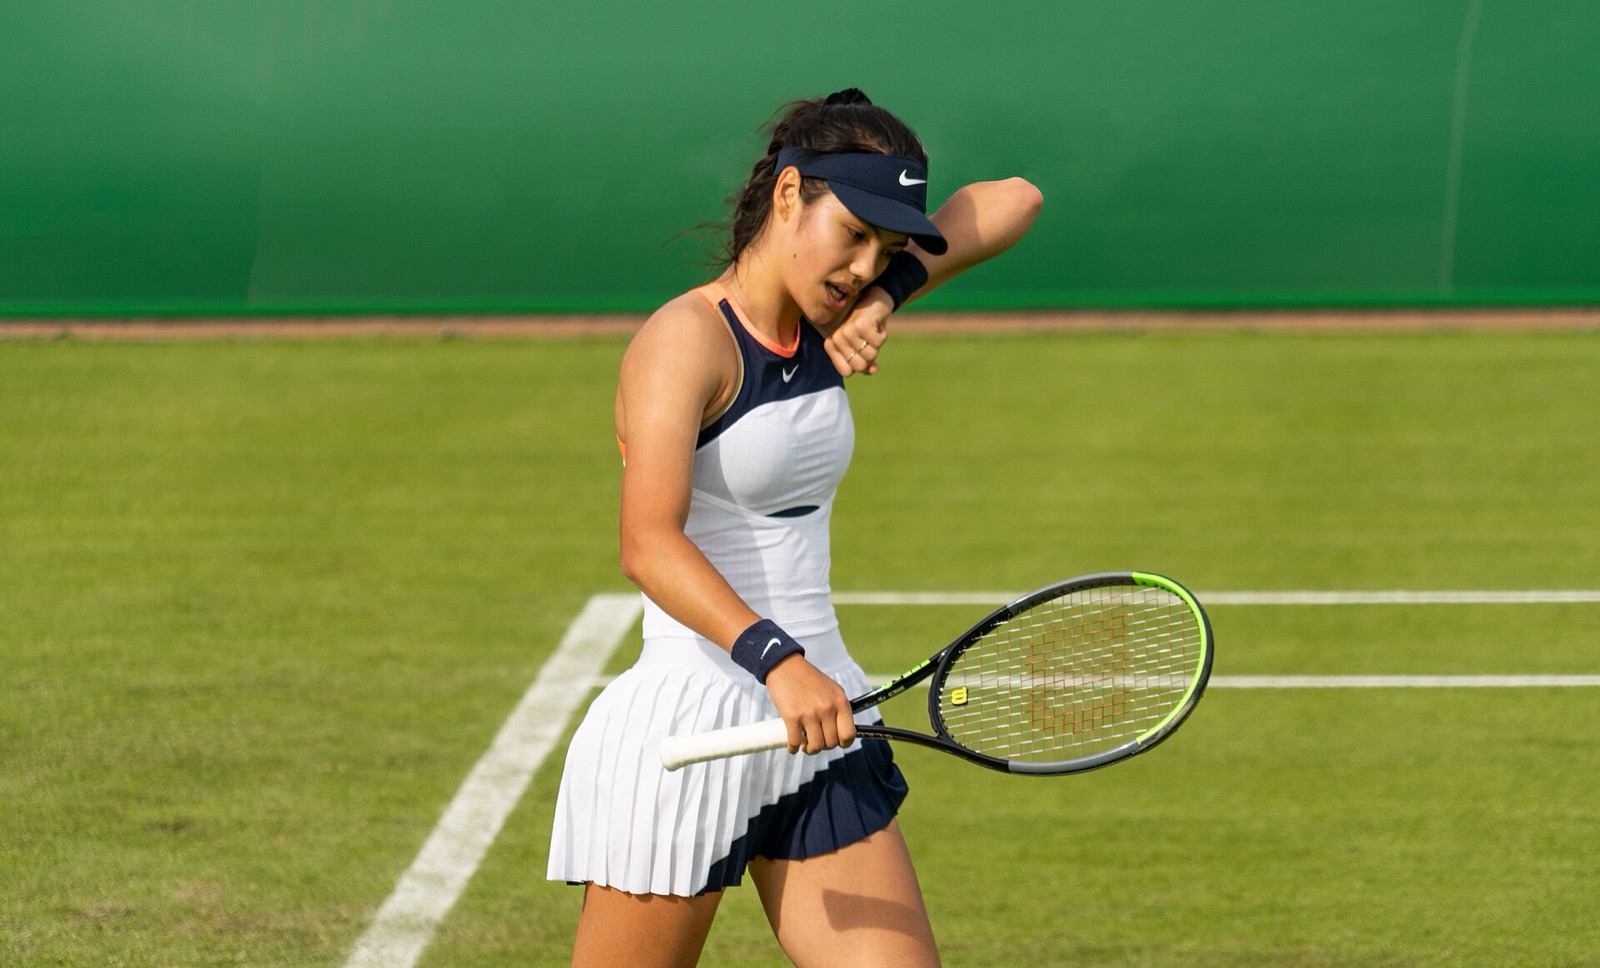
Nottingham, June 2021. Chris Czermak, CC BY 2.0
My flights were booked at the end of qualifying.
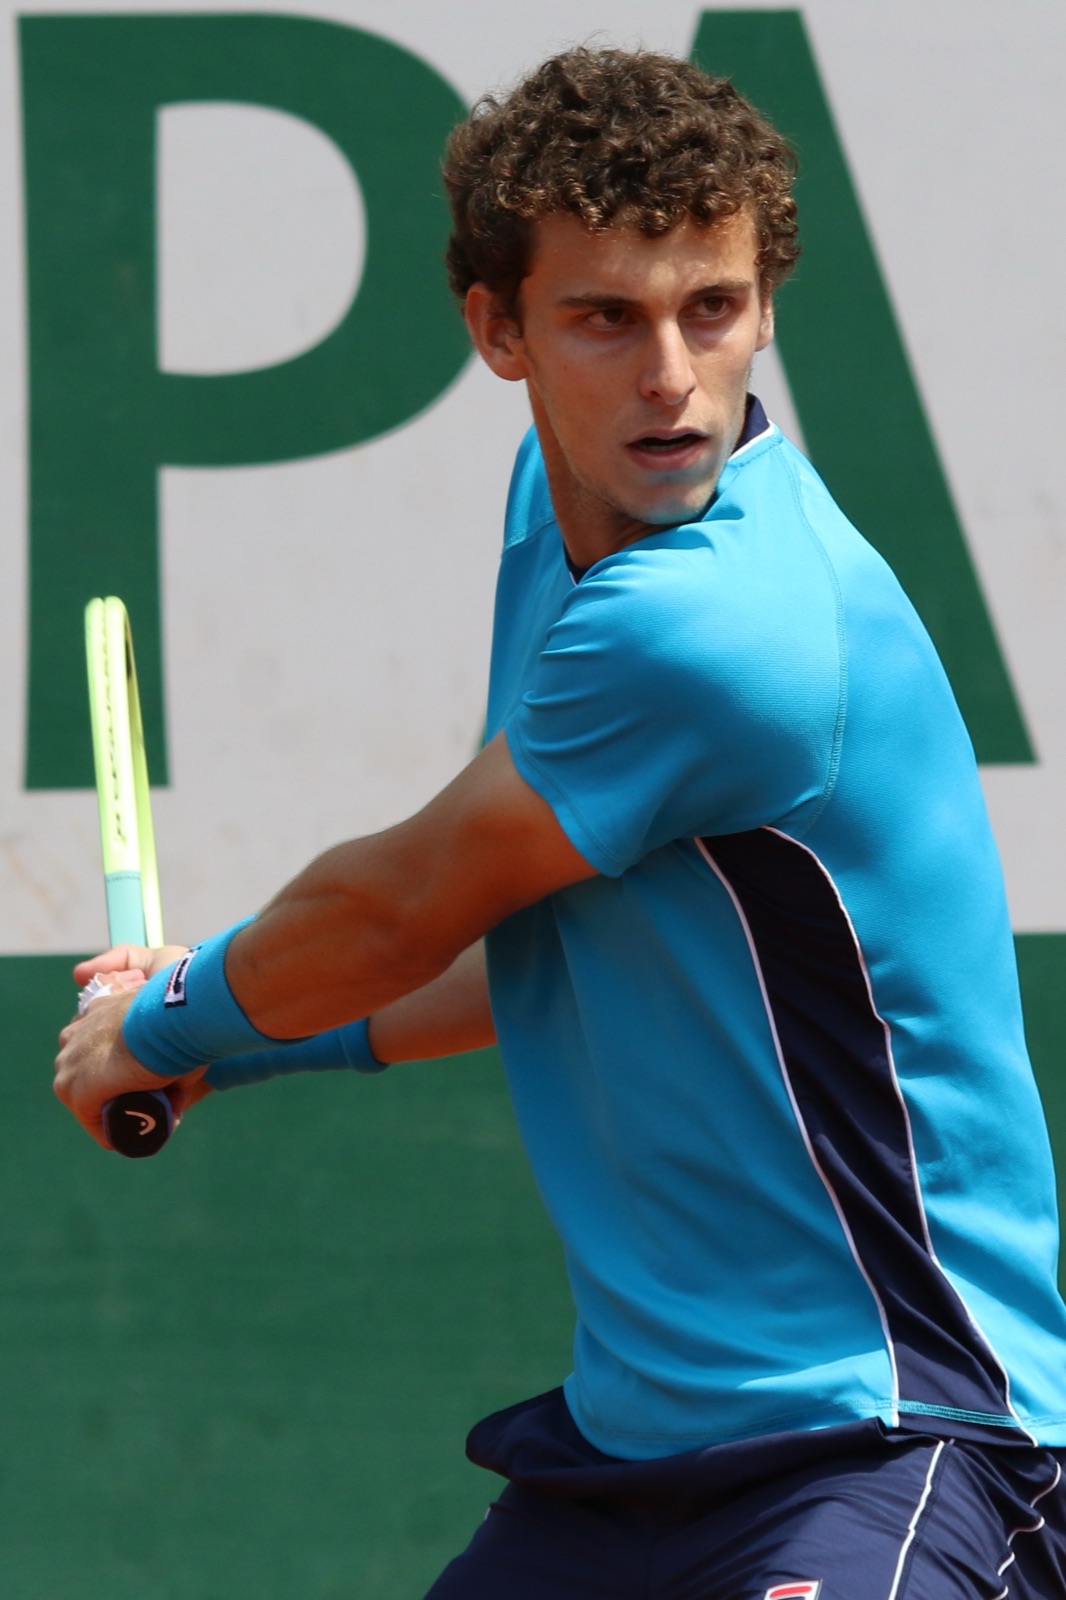
Emma Raducanu, 18, ranked 150th
Press conference, 8 September 2021, reported by AP
She had to win three qualifying matches just to get into the draw, and she expected to be flying home soon after.
She won ten matches in a row without dropping a set and won the US Open.
30%of professional tennis matches since 2001 were won by the player the bookmakers expected to lose.
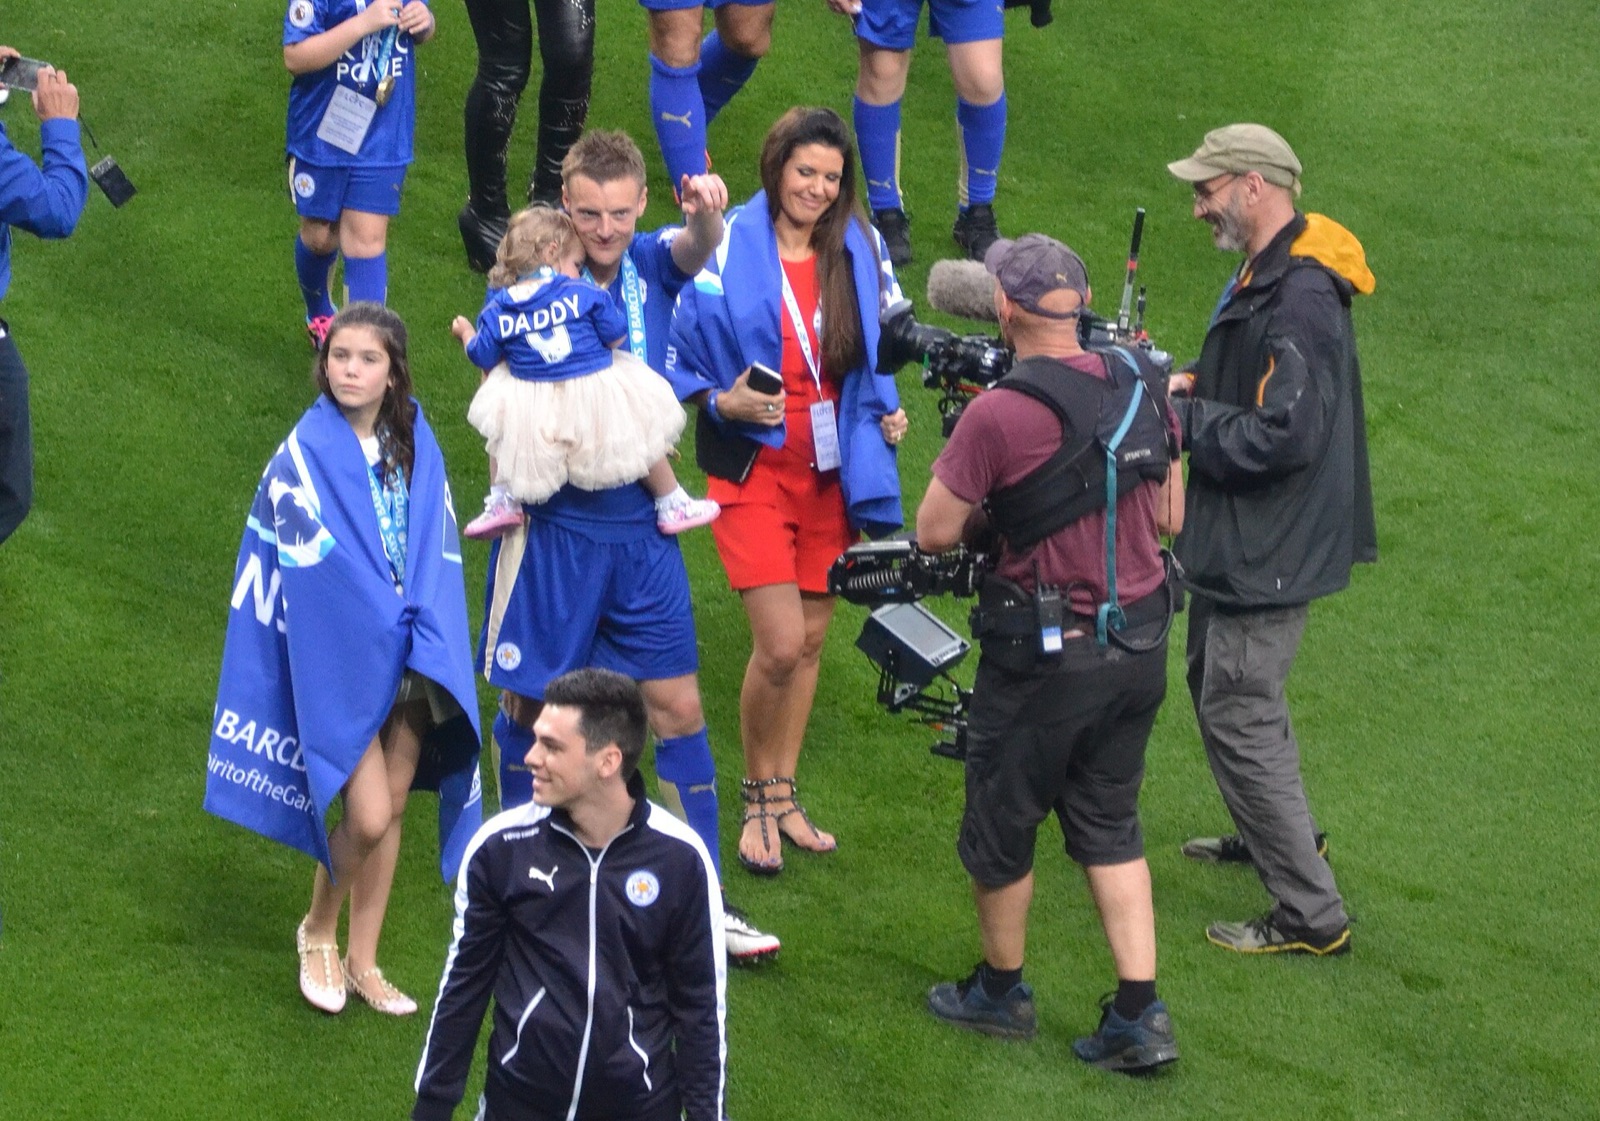
Title day, May 2016. Peter Woodentop, CC BY-SA 2.0
She was running against Joe Crowley, the fourth-ranking Democrat in the House, who spent $3.4 million to her $209,617.
She won the primary 57% to 43%.
35%of US House races where both candidates spent over $1 million went to the one who spent less.
Everyone at once
We took every professional match since 2000 that had a bookmaker's price on it, 370,713 of them in eight sports, and sorted the underdogs by how long their odds were. Each block below is a hundred of them, and the green dots are the ones who won.
Source: sheets.works count of 370,713 matches with a pre-match price, football-data.co.uk, tennis-data.co.uk, nflverse and public odds archives, 2000 to 2026. Hover or tap a block for the exact count.
Leicester were 5,000 to 1. This block has 5,000 dots, and one of them is Leicester.
Hover or tap to look for them
The 5,000 to 1 was a price set before the 2015-16 season on Leicester winning the whole league, a different kind of bet from the single matches above, so it gets a block of its own.
It depends on the game
The same underdog has a very different chance depending on what they are playing. In baseball the side the bookmakers expected to lose won 42 games in every hundred, and in European football they won only 23, although football hands them another 27 draws, so half the time the smaller side walks off without losing.
Each row is 100 matches. Green: the underdog won. Light: a draw. Hover or tap a row for the counts.
The smaller the stage, the better the odds
In football the gap between the best and worst team in a league matters more than the name on the shirt, so the underdog wins more often the further down the pyramid you go. In England's fourth tier the side expected to lose won 27 games in a hundred, and in the Premier League 21. Tennis works the other way at the biggest events, because best of five sets gives the better player more time to recover: at the men's Grand Slams the underdog won 23.5% of matches, and 31.8% everywhere else.
Underdog wins as a share of all league games, 2000 to 2026, 196,150 games in 22 divisions. Source: sheets.works count of football-data.co.uk
Already losing
The odds are set before anything happens, so we also looked at teams that were already behind. Of 124,906 football teams losing at half-time since 1998, 9,767 went on to win and another 22,325 got a draw, which means one in four losing teams walked off without a defeat.
Three goals down at half-time, and won
It happened 15 times in 216,952 games, and one of those teams was four goals down.
Away from sport
Matches are the cleanest place to count, because every one has a winner and a price, but the same question can be asked of wars, courts and elections, although those counts are rougher.
Small sides in war have been winning more
In wars since 1800 where one side was at least five times stronger, the small side won or held out in 12% of those that began before 1850 and in 51% of those that began after 1950. Those figures count a stalemate as a win for the small side, and if you split them out, insurgents fighting a state between 1950 and 2005 won outright 34% of the time, drew 35% and lost 31%.
Arreguín-Toft (2005), figure 2; Lyall and Wilson (2009), our count
One person against the government, in court
At the European Court of Human Rights, 84% of the 24,511 judgments since 1959 found that a government had broken someone's rights, but 94% of applications were thrown out before a judgment was ever written. At the US Supreme Court since 1946, a person facing a company won 57% of the time, and a person facing the federal government 39%.
ECHR Overview 1959 to 2021; Supreme Court Database 2024, our count of 8,088 argued cases
Spending less and winning anyway
In US House races from 2014 to 2024, leaving out 2022, where both candidates spent over a million dollars, the one who spent less won 35% of the time, but a challenger beat the sitting member only 4% of the time, and a candidate outspent ten to one won once in 791 races. In India's Lok Sabha only 55% of MPs who stood again between 1967 and 2019 were re-elected.
OpenSecrets and FEC, our count; Carnegie Endowment and Trivedi Centre (India)
At the board and on the bracket
On Lichess in January 2014, a player rated 400 to 500 points lower won 11.6% of 22,483 games, more often than the rating system itself predicted. In the men's college basketball tournament a number 16 seed has beaten a number 1 twice in 164 tries, UMBC over Virginia in 2018 and Fairleigh Dickinson over Purdue in 2023.
sheets.works count of the Lichess open database; NCAA tournament records
What the ones who made it did
Looking at the comebacks one at a time makes them feel like luck, so we went back to the big datasets to see whether the Davids who won had anything in common. Four things kept turning up, and each of them is something a person could choose to do.
They didn't fight Goliath's way
Ivan Arreguín-Toft listed 200 wars since 1800 where one side was at least five times stronger. When the small side lined up and fought the big side's kind of war it mostly lost, and when it refused, usually by avoiding the big battle and making the big side come to it, it won nearly two times in three, though that second group is only 22 wars.
Arreguín-Toft, How the Weak Win Wars (2005)
They found a lever that wasn't force
Erica Chenoweth and Maria Stephan collected 323 big campaigns to remove a government, end an occupation or break away, and the ones that used marches, strikes and boycotts instead of weapons succeeded more than twice as often, because far more ordinary people were willing to join them.
sheets.works count of NAVCO 1.1, Chenoweth and Stephan (2011)
They brought in people from another field
When companies posted problems their own scientists were stuck on to InnoCentive, a challenge website anyone could join, strangers solved almost a third of them, and some of the winning answers came from people in another field altogether, like a protein crystallographer who cracked a toxicology problem.
Jeppesen and Lakhani, Organization Science (2010)
They got help from outside
Of the 286 insurgencies Jason Lyall and Isaiah Wilson studied, the ones with no outside help won outright 12% of the time, and the ones with a safe place across a border or support from another country won 46%, which is close to four times as often.
Lyall and Wilson (2009), our count
Your line
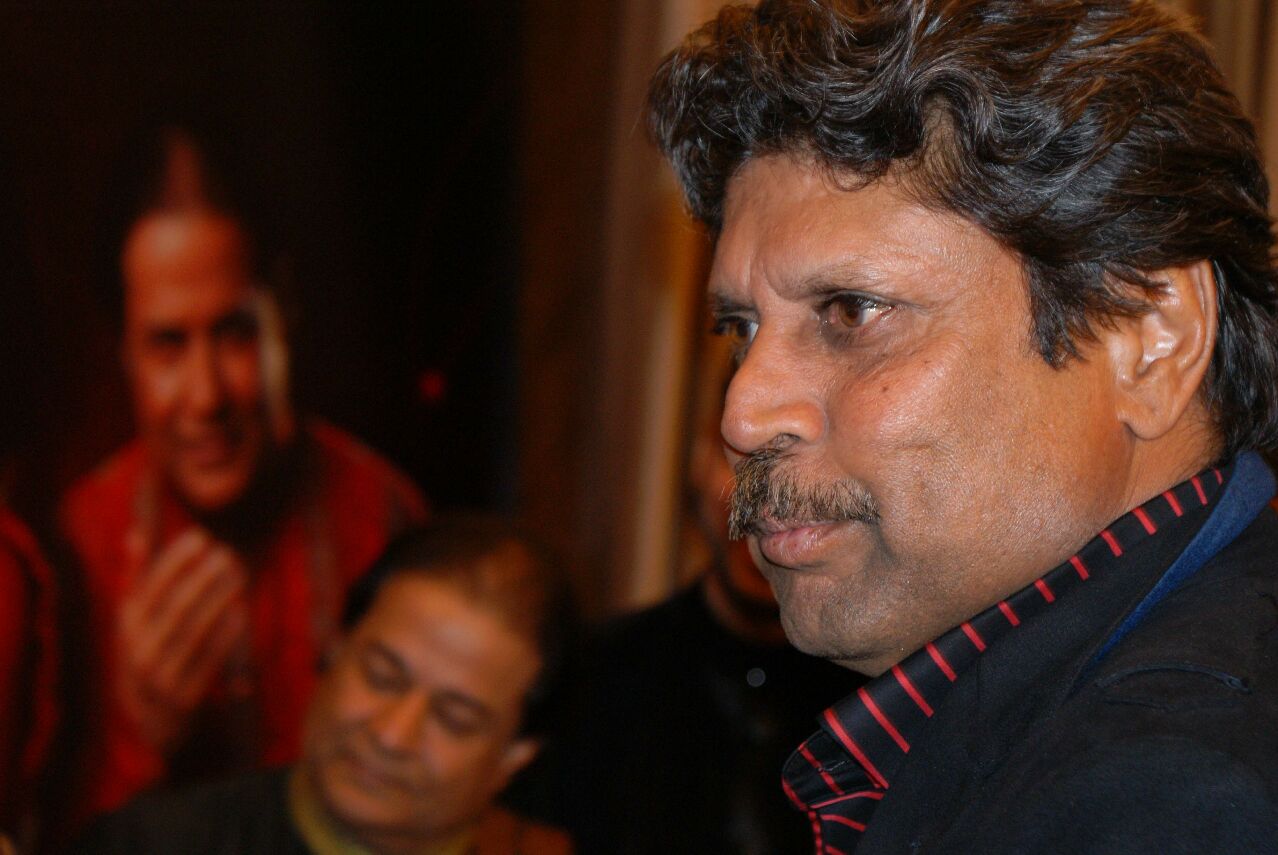
Kapil Dev's line was only about getting to 100. Mine is the one near the top of this page, so write yours over it, or keep mine, and we'll turn it into a card you can keep or send to somebody who needs it.
Nothing you type leaves your phone or computer
1 in 3.6matches since 2000 went to the side nobody expected to win, 102,978 of them. That line goes on your card underneath your sentence.
Most Davids lose, and the people in these datasets are the ones whose fights got big enough to be counted, so somebody crushed in their first week never shows up. Money is the hardest thing to beat: in US House elections from 2014 to 2024, a candidate outspent ten to one won once in 791 races. Long shots also win less often than their odds suggest: sides priced at 10 to 1 or longer won 3.9% of the time when the price said about 6.6%. What this page has is a count of how many people were where you are and got out anyway.
How we did it
Underdogs and comebacks. 370,713 matches with a pre-match bookmaker price across eight sports, 2000 to 2026 (football-data.co.uk, tennis-data.co.uk, nflverse, SportsBookReview archives and others); the underdog is the side with the longer price, with the bookmaker's margin removed. Half-time figures come from 216,952 European league games (1998 to 2026), and two-sets-down figures from 12,379 men's Grand Slam matches (2001 to 2026).
Everything else. War figures from Arreguín-Toft (2005). Campaign figures from NAVCO 1.1. Court figures from the European Court of Human Rights' Overview 1959 to 2021. Election spending from the FEC and OpenSecrets. The tables we computed and the scripts that made them are in one zip file.